Viewing a process
This article is valid for the new Process (PM063) unified menu in system version 3.0:
- Access the release notes for further details about the significant changes in the unification of the menu.
- Click here to access the valid documentation for the old view menu.
Prerequisite
- Access to the Process (PM063) menu.
Introduction
SoftExpert Process provides a menu that, in addition to creating, also allows quickly and efficiently viewing the data of the processes recorded in the system, such as the process tree, the input & output diagram, the turtle diagram, the process flowchart, the RACI Matrix, the CMDB, and the process mining analysis.
See below further details about how to view processes:
Viewing a process
1. To view the data of a process, access the Process (PM063) menu.
2. Use the search filters to find the desired process and click on the Search button.
3. In the list of records, right-click on the process.
4. Then, choose between the Open data and Open flowchart options.
In addition to viewing the flowchart and the process data screen, it is possible to check other information:
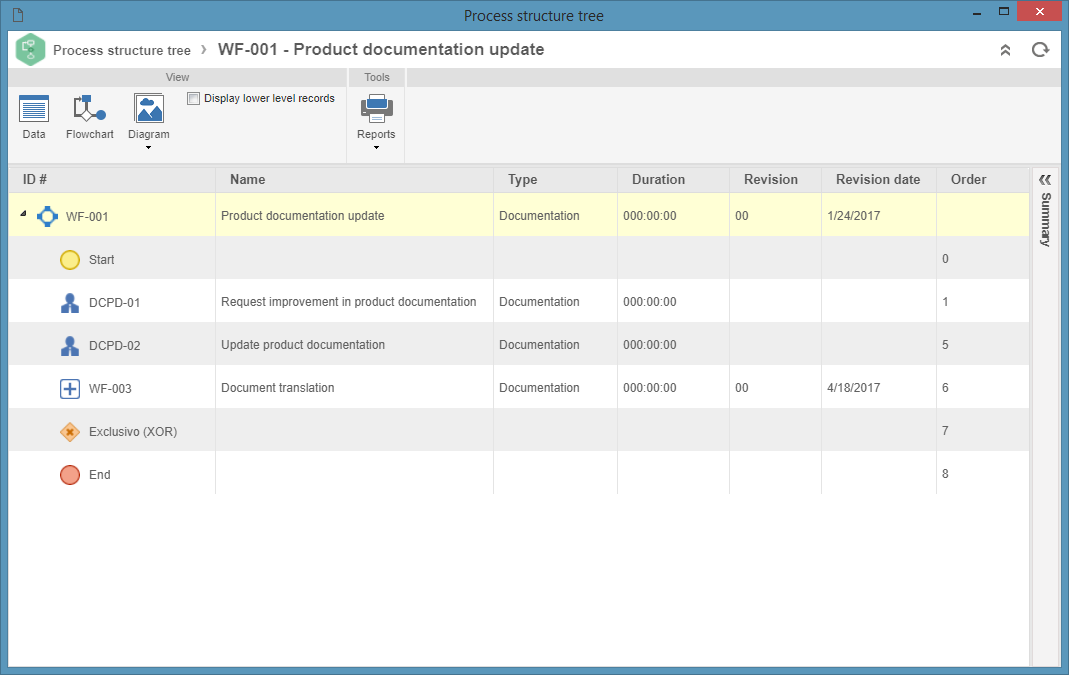
Process tree
After right-clicking on the process, select the Open process tree option.
On the screen that will open, it is possible to view the process data in a tree format.
See a process tree example below:
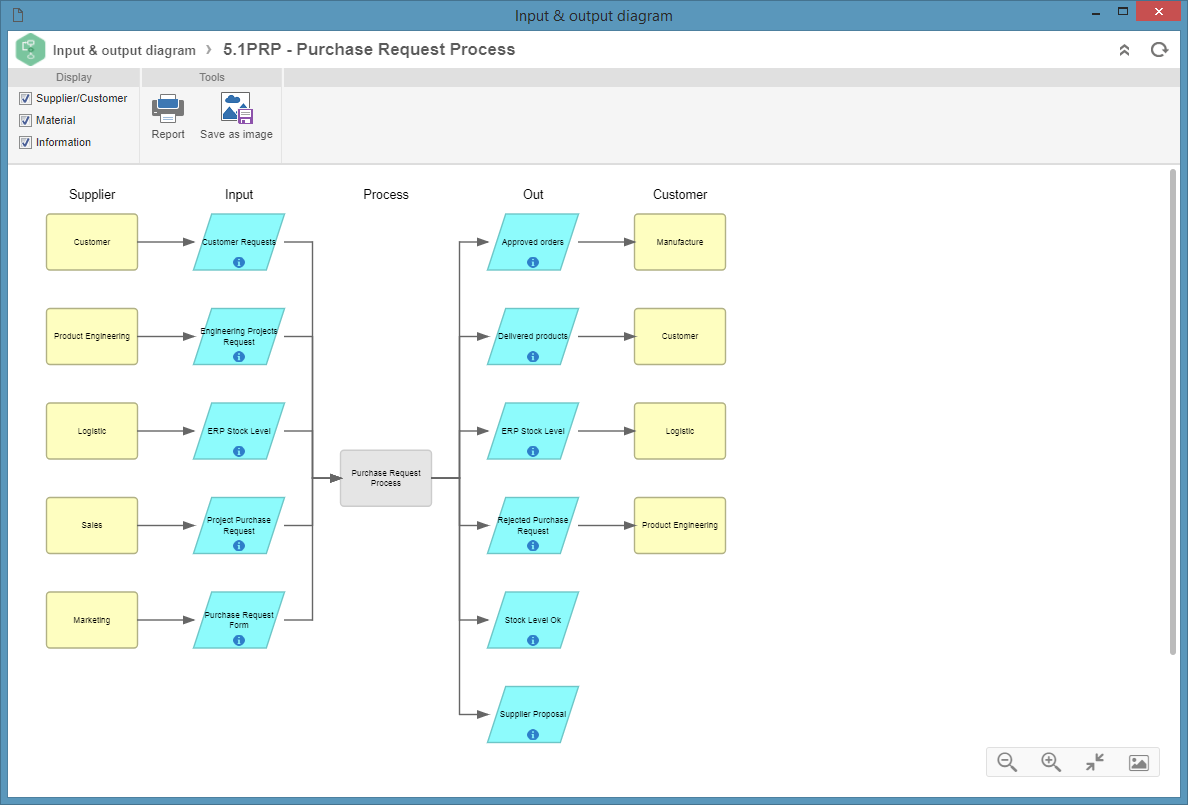
Input and output diagram
After right-clicking on the process, select the Open I/O diagram option.
On the screen that will open, it is possible to generate a diagram in order to display all the inputs and outputs of materials and information that occurred in the process items, in addition to the stakeholders.
The information in the diagram is divided into five columns:
| Supplier | Displays the suppliers of the materials/information of each input. Each rectangle in this region represents a supplier. |
| Input | Displays all information or materials used by the process. Each parallelogram in this region represents an input. Click on the item to open its data screen. |
| Output | Displays all information or materials generated by the process. Each parallelogram in this region represents an output. Click on the item to open its data screen. |
| Process | Displays the process item. If this process has subprocesses, they can be viewed (in an input and output diagram, in a new tab) by expanding the process using the  icon. Click on the item to open its data screen. icon. Click on the item to open its data screen. |
| Customer | Displays customers that purchase input materials and information. Each rectangle in this region represents a customer. |
- It is also possible to generate the I/O diagram through the File > Activity/Decision (PM019) and View > Activity/Decision (PM024) menus. Simply select a record in the list, click on the More option from the toolbar, and select View diagram.
- Input and output information and materials are associated on the process or activity data screen.
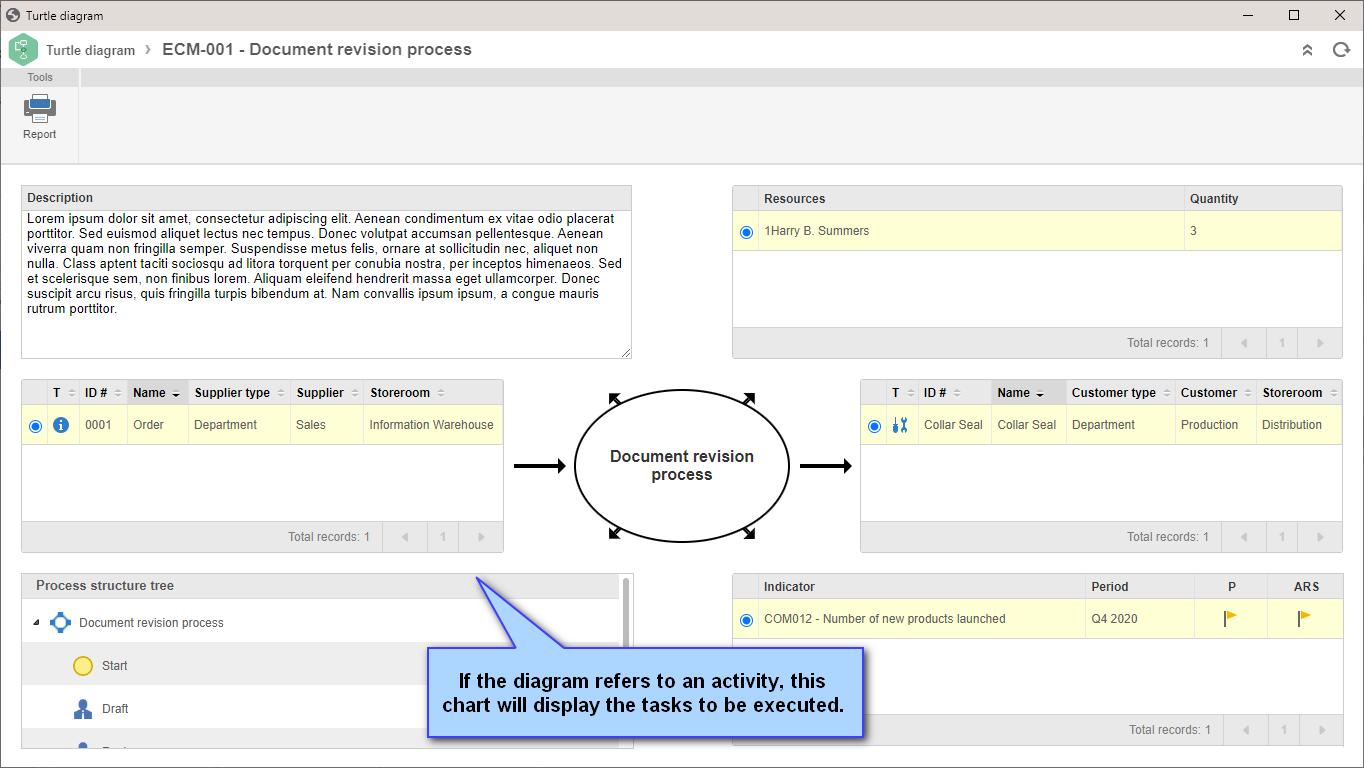
Turtle diagram
After right-clicking on the process, select the Open turtle diagram option.
The Turtle diagram is an analysis tool that can be applied to all types of activities, decisions, and processes identified in the organization.
Each diagram has six boxes that focus on the process execution, inputs, and outputs.
See an example of the diagram:
It is also possible to generate the turtle diagram through the File > Activity/Decision (PM019) and View > Activity/Decision (PM024) menus. Simply select a record in the list, click on the More option from the toolbar, and select Turtle diagram.
Process flowchart
After right-clicking on the process, select the Open flowchart option.
On the screen that will open, it is possible to enable the process for editing, provided that the user has the appropriate permissions, and the process type has simplified revision control. To this end, simply click on the Enable editing button, displayed on the process flowchart screen and on the process data screen.
However, in processes whose types have ISO9000 or Workflow revision control, changes can only be made by the drafter in the revision draft step.
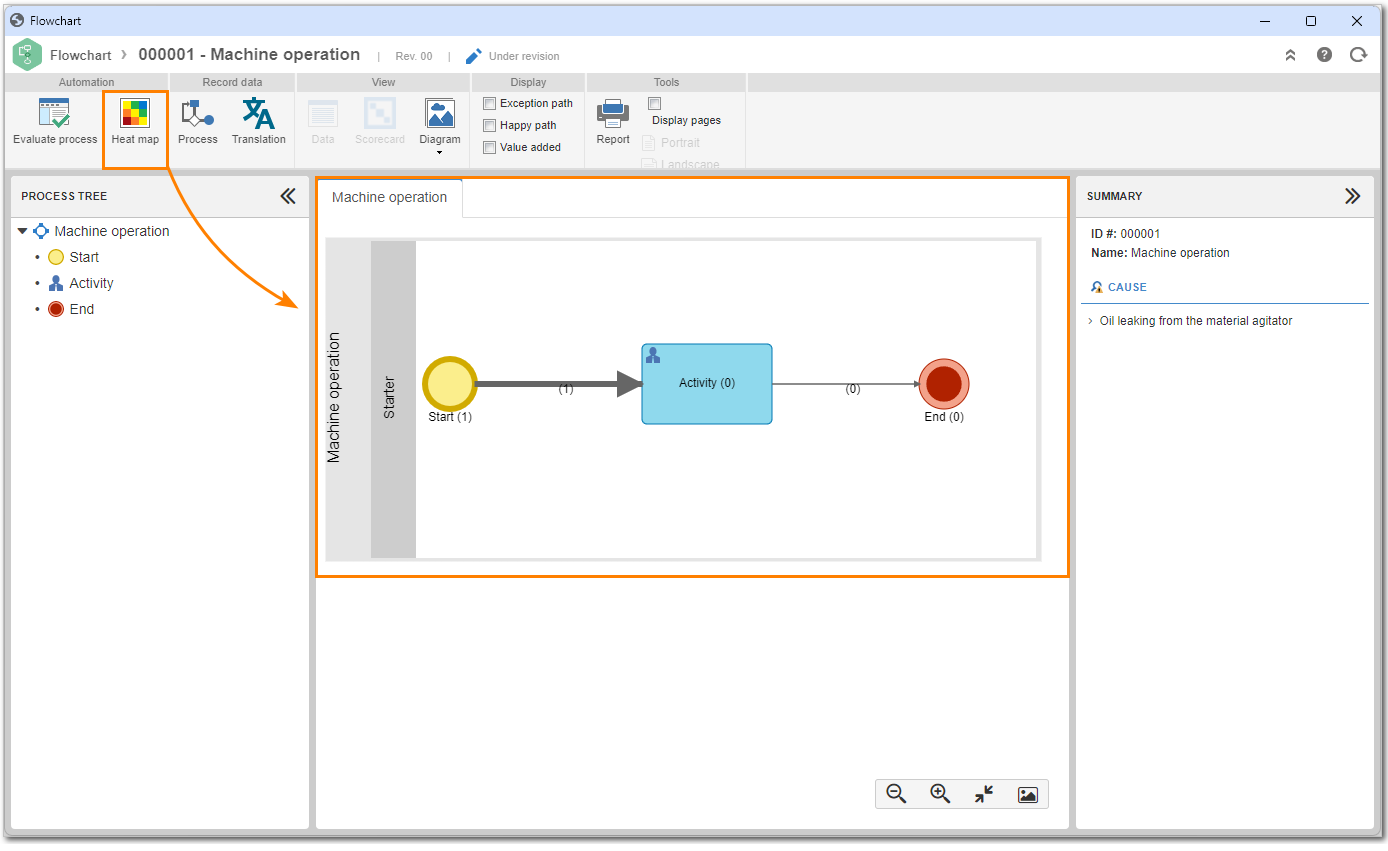
See, below, an example of a process flowchart:
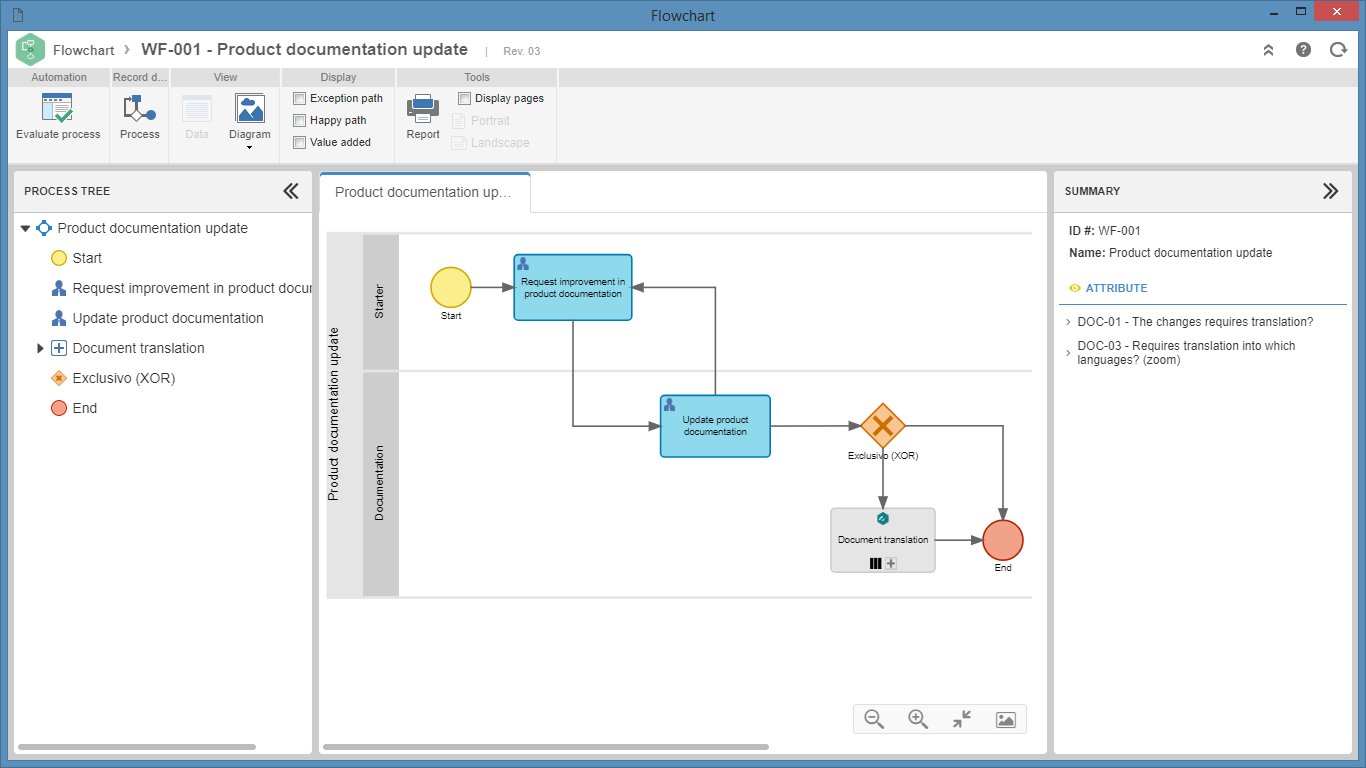
Above the process flowchart, the Heat map button is displayed. This resource allows users to analyze the execution of process instances. This tool enables tracking the most accessed routes in the flowchart, checking which process steps work better and are more executed. Thus, it is possible to understand where improvements should be made and how failures can be avoided.
RACI Matrix
After right-clicking on the process, select the Open RACI matrix option.
On the screen that will open, it is possible to view the RACI matrix of the process. See the example below:
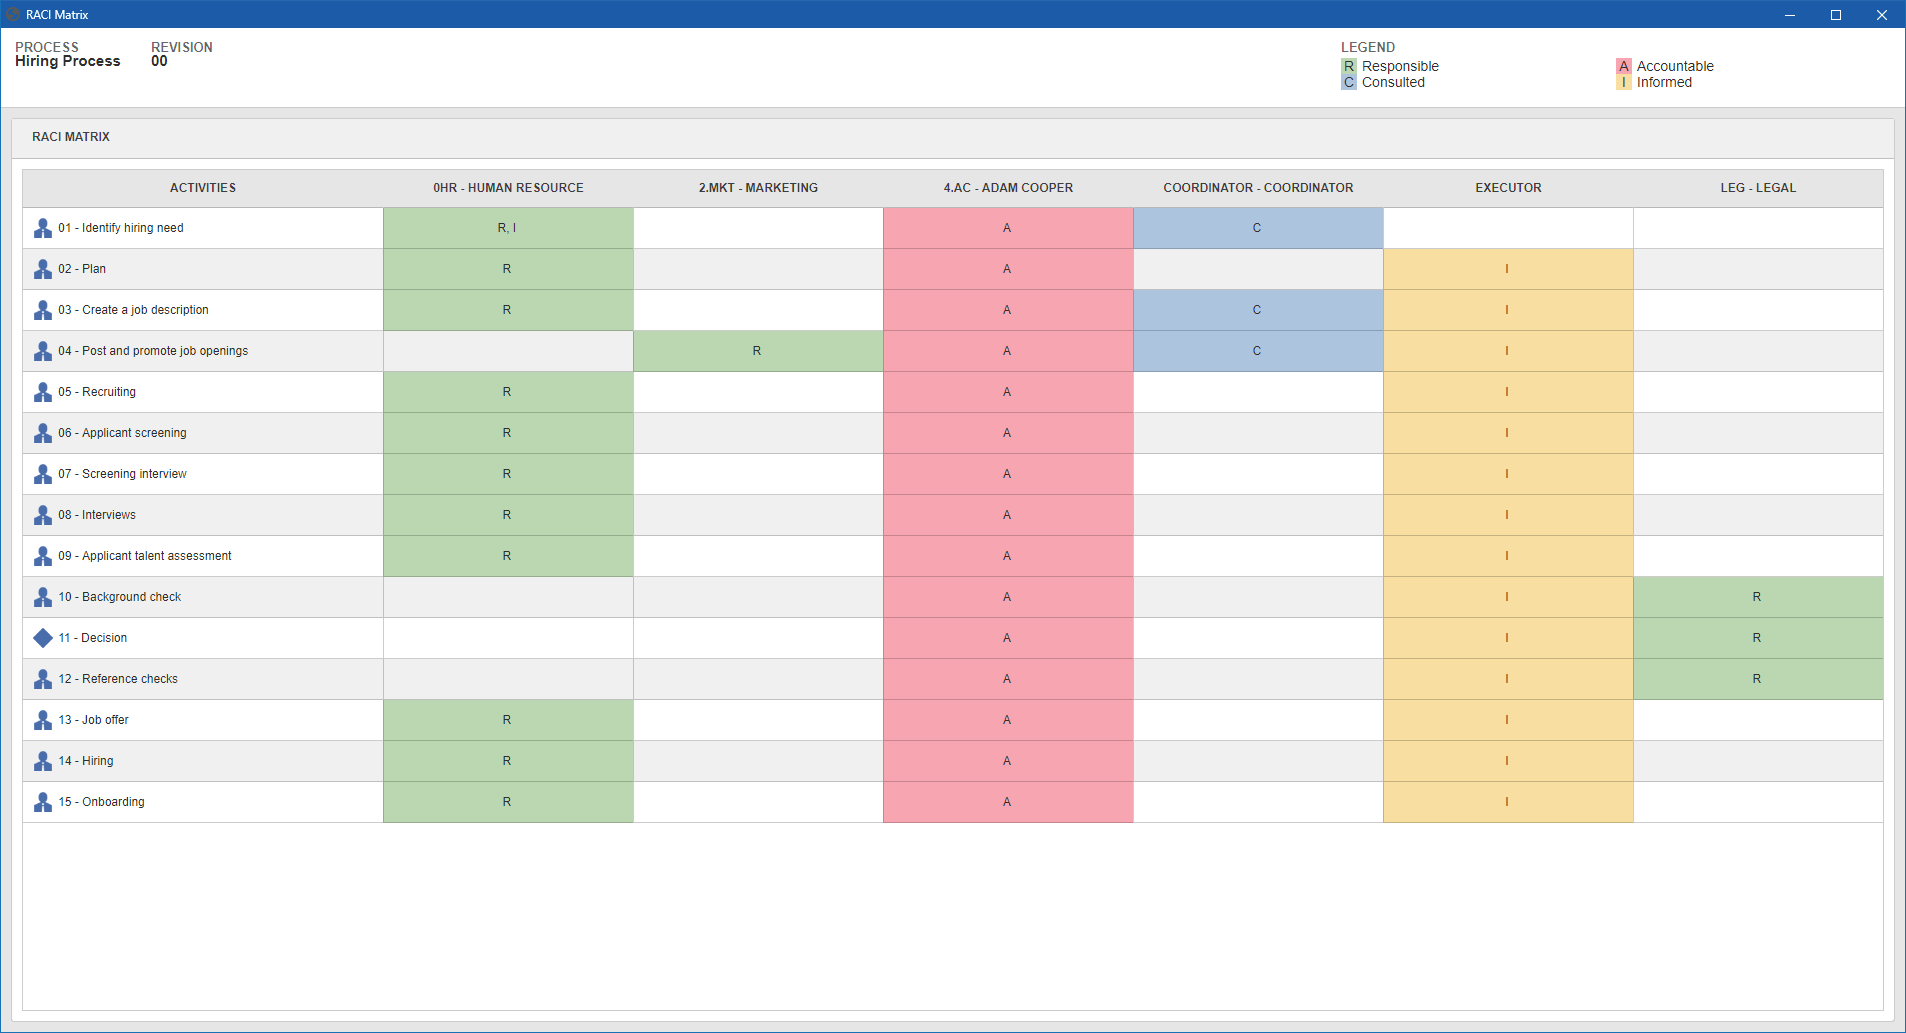
It is infeasible to track the schedule and manage the scope (and the deliverables) without the team members having the proper knowledge of their responsibilities in the life cycle of the process.
The matrix assists in human resources management during the development of the process by clarifying the roles to be performed over time.
With it, it is possible to map all parties involved, assigning functions to each person in the activities to be carried out. The RACI matrix is composed of an acronym, which also defines the roles and duties of those involved:
| Responsible |
Group of people (or individual) responsible for executing, developing, completing, and delivering the activity. In the system: corresponds to the activity executor. |
| Accountable |
Corresponds to the party with authority to organize the task, track its development and accept or formally reject a delivery. The accountable role is that of the approver, who will be held accountable for any deviations. Thus, there should only be one authority per task. In the system: corresponds to the party responsible for the process. |
| Consulted |
Everyone who can provide tips, opinions, and suggestions to improve the development of the activity or enhance the deliverable. They must answer the questions of the responsible party, who, in their turn, must involve these people whenever necessary in order to add value or resolve doubts regarding the task being executed. In the system: the human resources associated with the activity. |
| Informed |
Everyone who must receive information on the completion and start of an activity (or even of a delivery) that will generate impacting changes in the process. In the system: the notified users of the activity. |
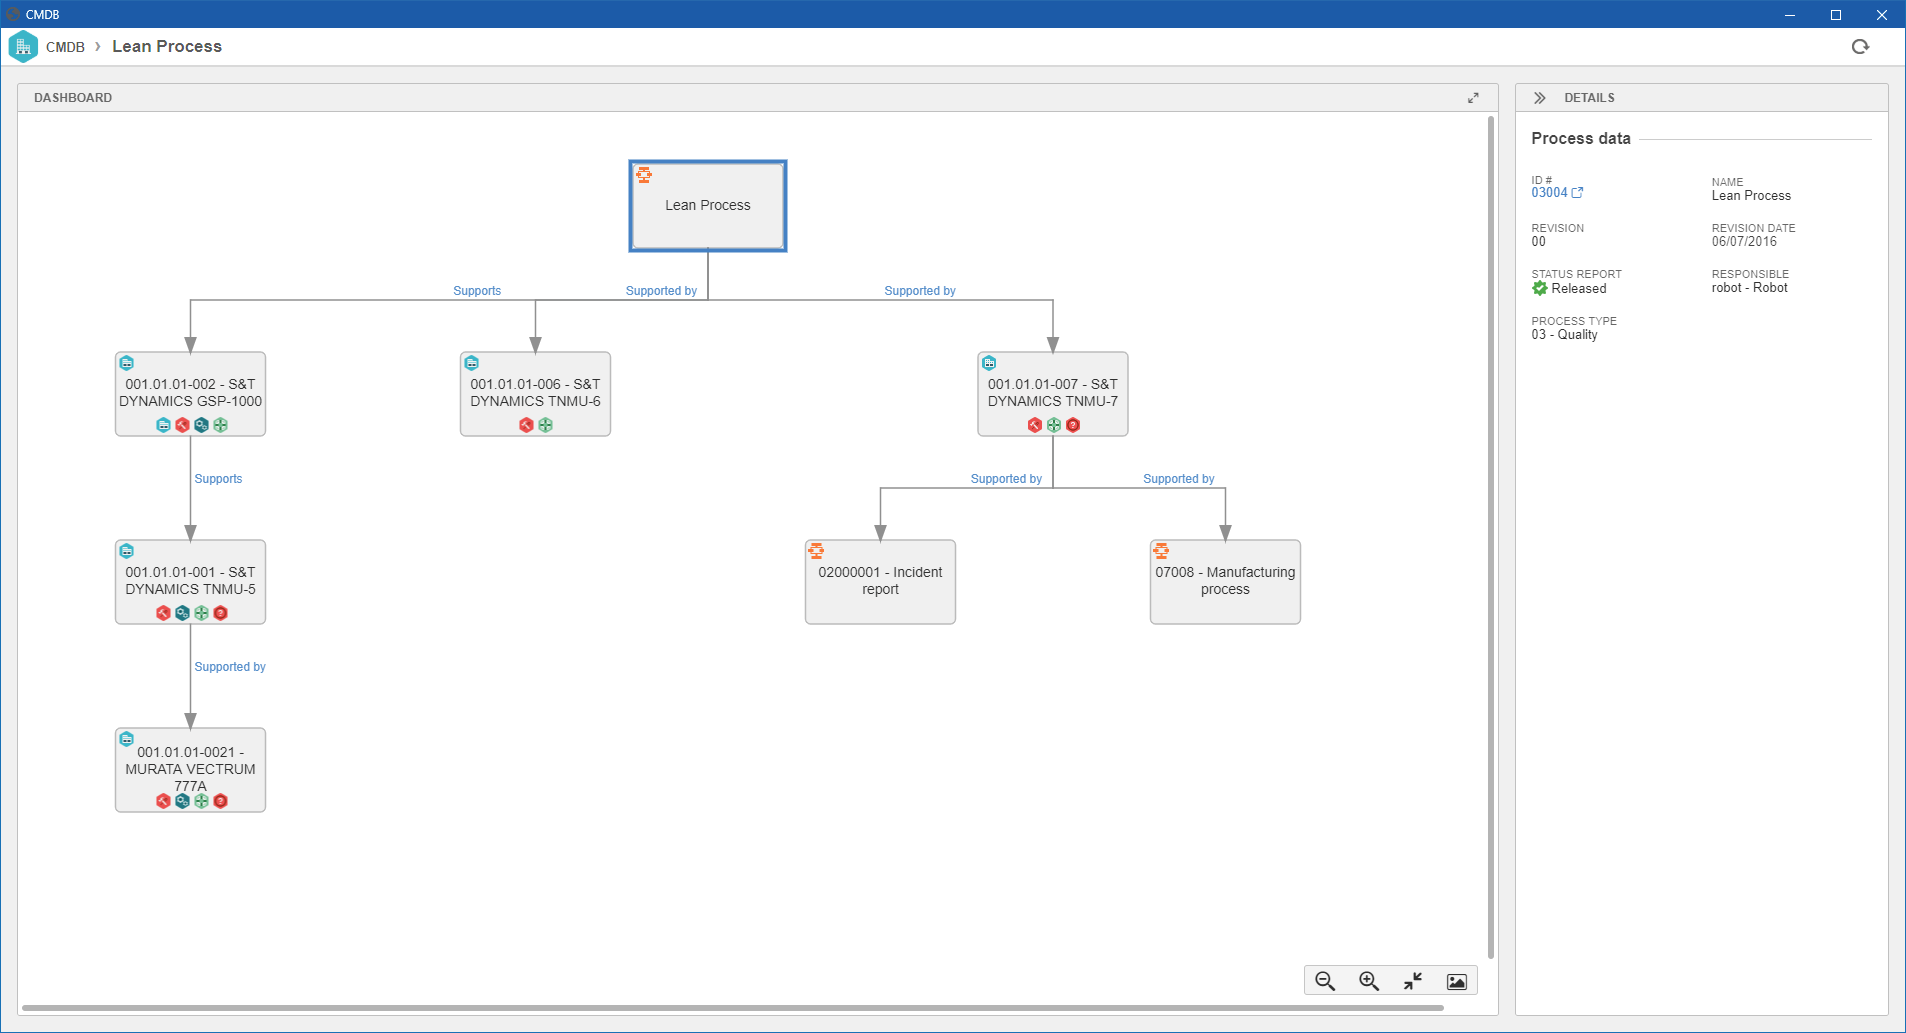
CMDB
The Configuration Management Database (CMDB) gathers relevant information about the components of an information system. It is mainly used in the IT services of an organization in situations that require detailed tracking of the relationship between assets and business processes.
After right-clicking on the process, select the Open data option and, on the screen that will open, click on the CMDB button available on the toolbar.
In SoftExpert Asset, the CMDB relationship structure can be accessed through the  button, located on the button bars of the following menus: Asset definition (AS016), View assets (AS030), and View computers (AS073).
The structure can also be viewed in the third quadrant of the menus mentioned above, through the Relationships option, which is available in the asset data screen.
Process mining analysis
Process mining aims to provide a detailed analysis of business processes, allowing the optimization of operations based on event records.
After right-clicking on the process, select the Open process mining analysis option.
For further details about the creation of the analysis, check the documentation of SoftExpert Data Lab.
Process mining analysis will only be available to customers using the SoftExpert cloud platform and with an active SoftExpert Data lab license.
Conclusion
Now you know how to view different types of data from processes created in the system in order to make their management even more complete!