Consultar processo
Este artigo é válido para o novo menu unificado Processo (PM063) na versão 3.0 do sistema:
- Acesse o release notes para mais detalhes sobre as mudanças significativas na unificação do menu.
- Clique aqui para acessar a documentação válida para o menu antigo de consulta.
Pré-requisito
- Acesso ao menu Processo (PM063).
Apresentação
O SoftExpert Processo disponibiliza um menu que permite, além de cadastrar, consultar de forma rápida e eficiente os dados dos processos registrados no sistema, como a árvore do processo, o diagrama de entradas e saídas, o diagrama de tartaruga, o fluxograma de processo, a matriz RACI, o CMDB e a análise de mineração de processos.
Veja a seguir mais detalhes sobre como consultar os processos:
Consultar processo
1. Para consultar os dados de um processo, acesse o menu Processo (PM063).
2. Utilize os filtros de pesquisa para buscar pelo processo desejado e clique no botão Pesquisar.
3. Na lista de registros, clique com o botão direito do mouse sobre o processo.
4. Então, escolha entre as opções Abrir dados ou Abrir fluxograma.
Além de visualizar o fluxograma e a tela de dados do processo, é possível consultar outras informações:
Árvore do processo
Após clicar com o botão direito do mouse sobre o processo, selecione a opção Abrir árvore do processo.
Na tela que será aberta, é possível visualizar os dados do processo em formato de árvore.
Veja a seguir um exemplo de árvore de processo:
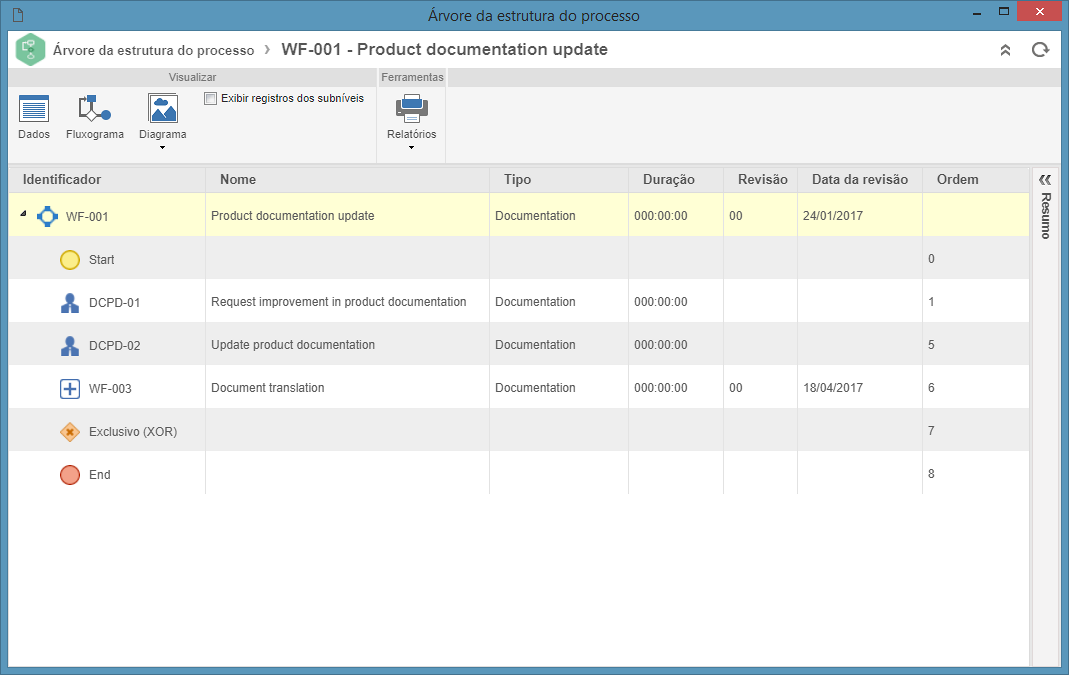
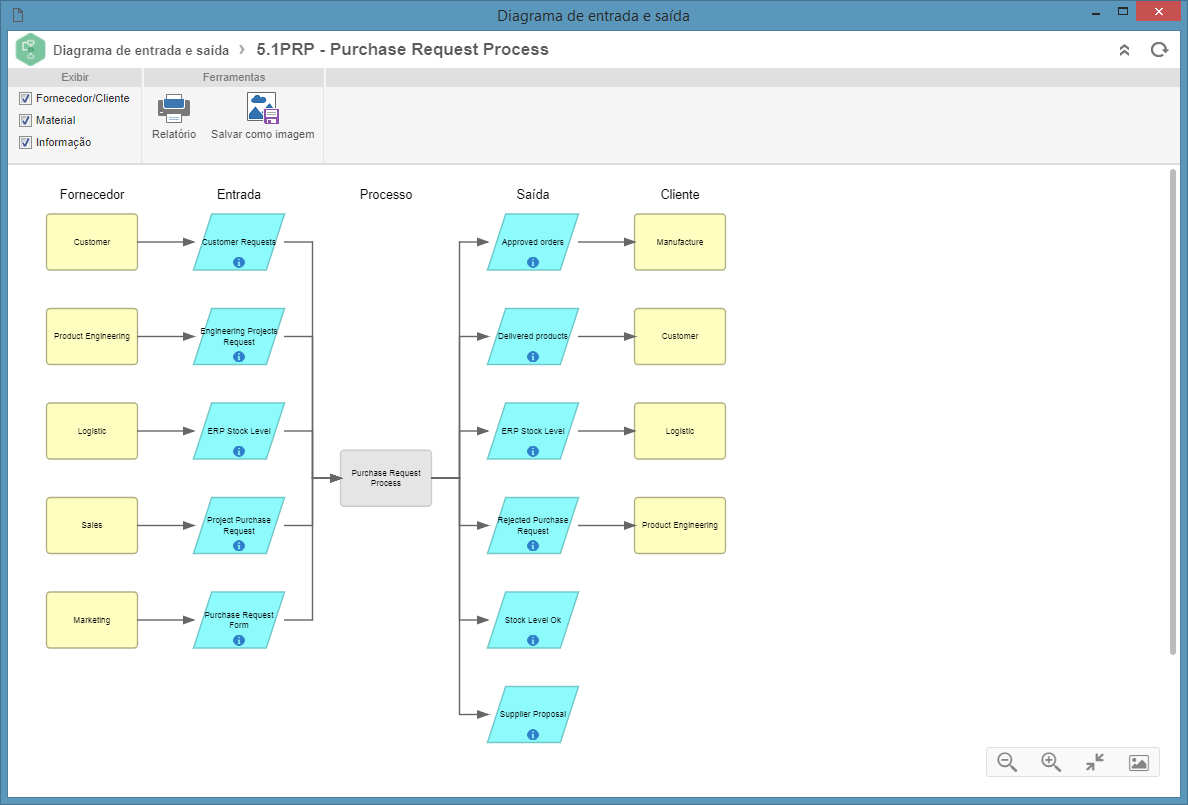
Diagrama de entradas e saídas
Após clicar com o botão direito do mouse sobre o processo, selecione a opção Abrir diagrama E/S.
Na tela que será aberta, é possível gerar um diagrama para apresentar todas as entradas e saídas de materiais e informações ocorridas nos itens do processo, além das partes interessadas.
As informações do diagrama estão divididas em cinco colunas:
| Fornecedor | Apresenta os fornecedores dos materiais/informação de cada entrada. Cada retângulo desta região representa um fornecedor. |
| Entrada | Apresenta todas as informações ou os materiais utilizados pelo processo. Cada paralelogramo desta região representa uma entrada. Clique sobre o item para que a respectiva tela de dados seja aberta. |
| Saída | Apresenta todas as informações ou os materiais gerados pelo processo. Cada paralelogramo desta região representa uma saída. Clique sobre o item para que a respectiva tela de dados seja aberta. |
| Processo | Apresenta o item do processo. Se este processo possuir subprocessos, eles poderão ser visualizados (em um diagrama de entradas e saídas, em uma nova aba) ao expandir o processo através do ícone  . Clique sobre o item para que a respectiva tela de dados seja aberta. . Clique sobre o item para que a respectiva tela de dados seja aberta. |
| Cliente | Apresenta os clientes que adquirem os materiais e a informação de entrada. Cada retângulo desta região representa um cliente. |
- Também é possível gerar o diagrama E/S por meio dos menus Cadastro > Atividade/Decisão (PM019) e Consulta > Atividade/Decisão (PM024). Basta selecionar um registro na lista, clicar na opção Mais, da barra de ferramentas, e selecionar Visualizar diagrama.
- As informações e os materiais de entrada e saída são associados na tela de dados dos processos ou das atividades.
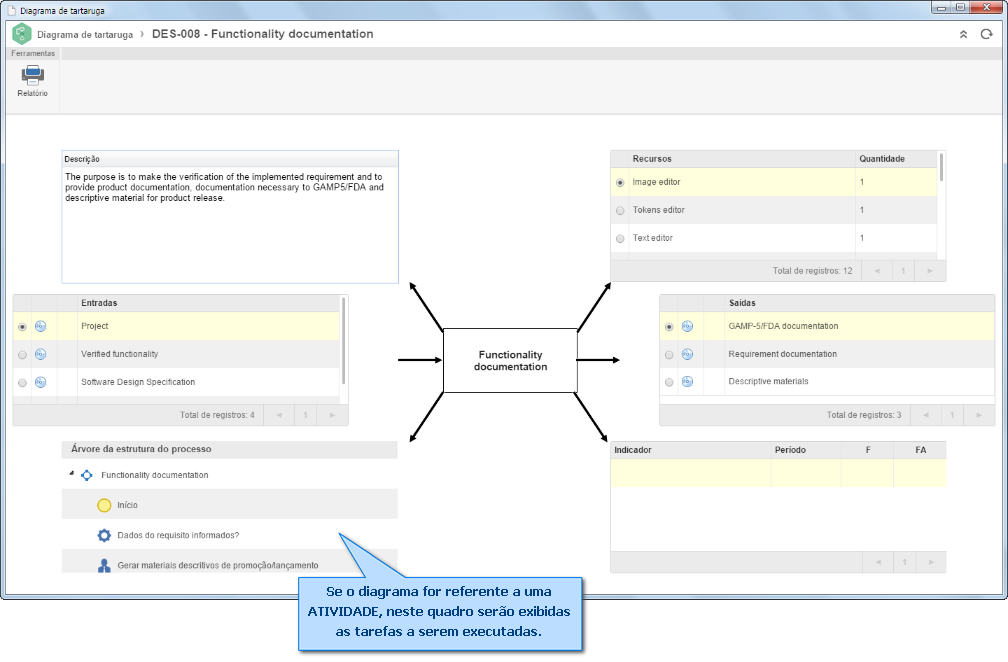
Diagrama de tartaruga
Após clicar com o botão direito do mouse sobre o processo, selecione a opção Abrir diagrama de tartaruga.
O Diagrama de tartaruga é uma ferramenta de análise que pode ser aplicada a todos os tipos de atividades, decisões e processos identificados na organização.
Cada diagrama contém seis quadros, que se concentram no funcionamento, nas entradas e nas saídas do processo.
Veja, a seguir, um exemplo do diagrama:
Também é possível gerar o diagrama de tartaruga por meio dos menus Cadastro > Atividade/Decisão (PM019) e Consulta > Atividade/Decisão (PM024). Basta selecionar um registro na lista, clicar na opção Mais, da barra de ferramentas, e selecionar Diagrama de tartaruga.
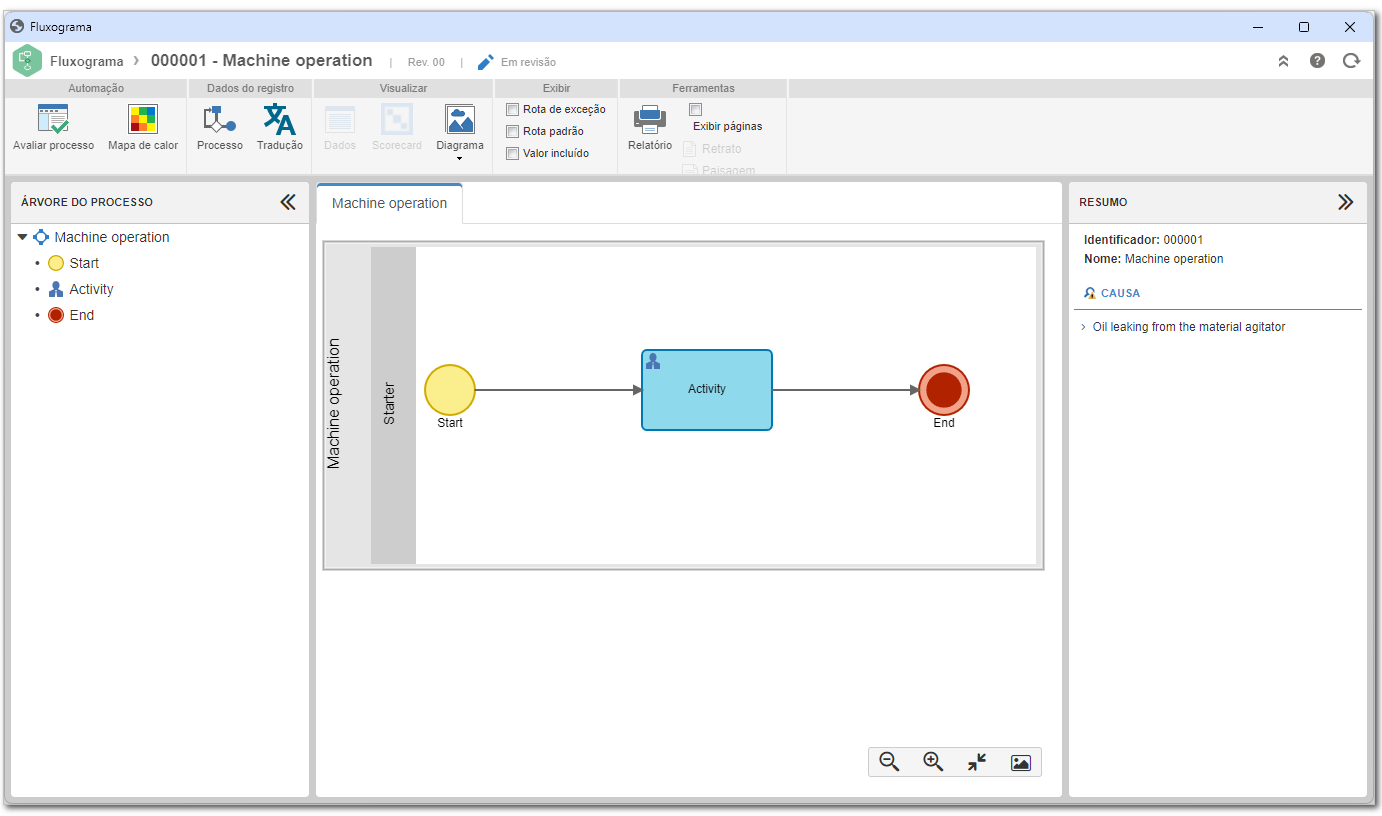
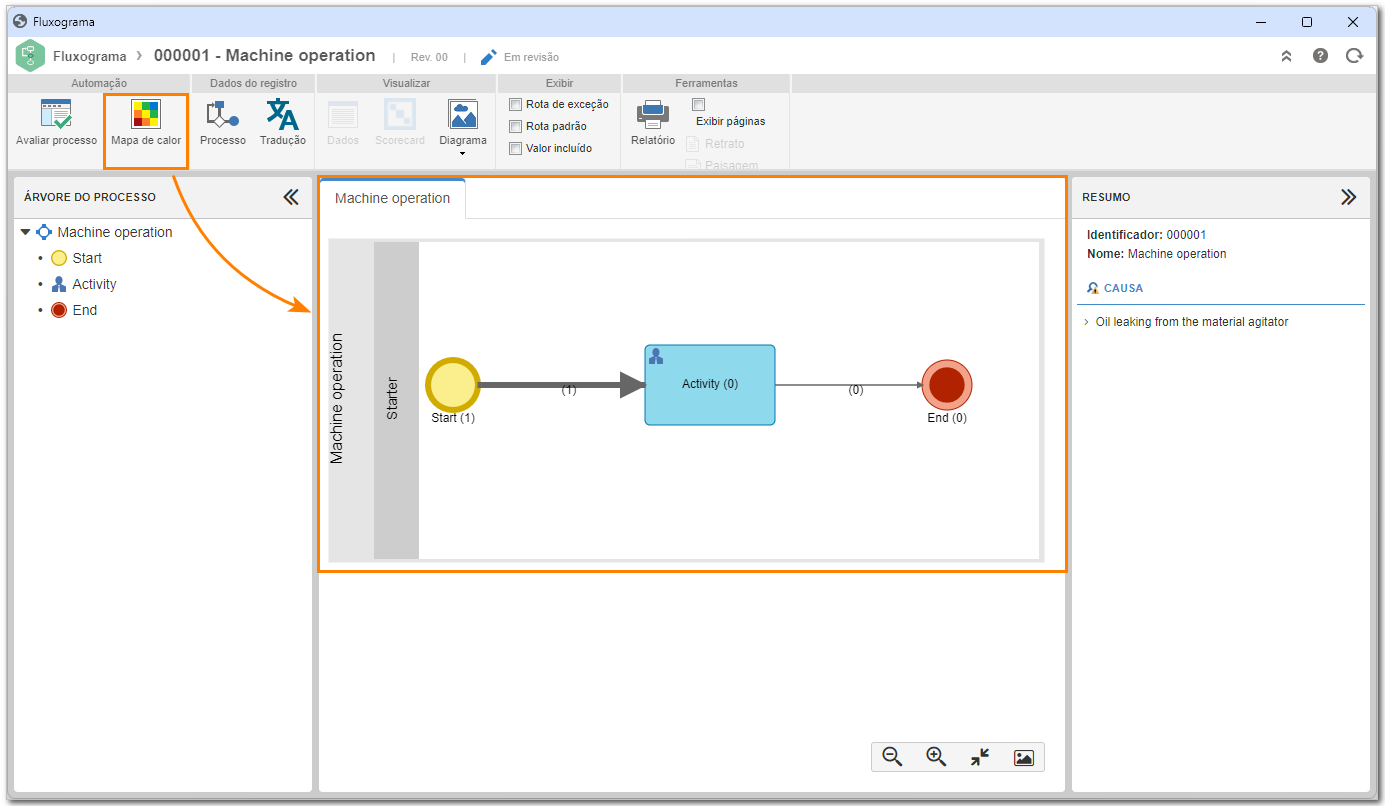
Fluxograma de processo
Após clicar com o botão direito do mouse sobre o processo, selecione a opção Abrir fluxograma.
Na tela que será aberta, é possível habilitar a edição do processo, desde que o usuário possua as devidas permissões e o tipo do processo tenha controle de revisão simplificado. Para isso, basta clicar no botão Habilitar edição, apresentado na tela do fluxograma e na tela de dados do processo.
Entretanto, nos processos cujos tipos possuem controle de revisão ISO9000 ou Workflow, as alterações somente poderão ser efetuadas pelo elaborador na etapa de elaboração de revisão.
Veja, a seguir, um exemplo de fluxograma de um processo:
Sobre o fluxograma do processo, há o botão Mapa de calor. Este recurso permite analisar a execução das instâncias do processo. A ferramenta possibilita acompanhar as rotas mais acessadas no fluxograma, verificando quais passos do processo funcionam melhor e são mais executados. Desta maneira, é possível entender onde devem ser realizadas melhorias e como as falhas podem ser evitadas.
Matriz RACI
Após clicar com o botão direito do mouse sobre o processo, selecione a opção Abrir matriz RACI.
Na tela que será aberta, é possível visualizar a matriz RACI do processo. Veja um exemplo a seguir:
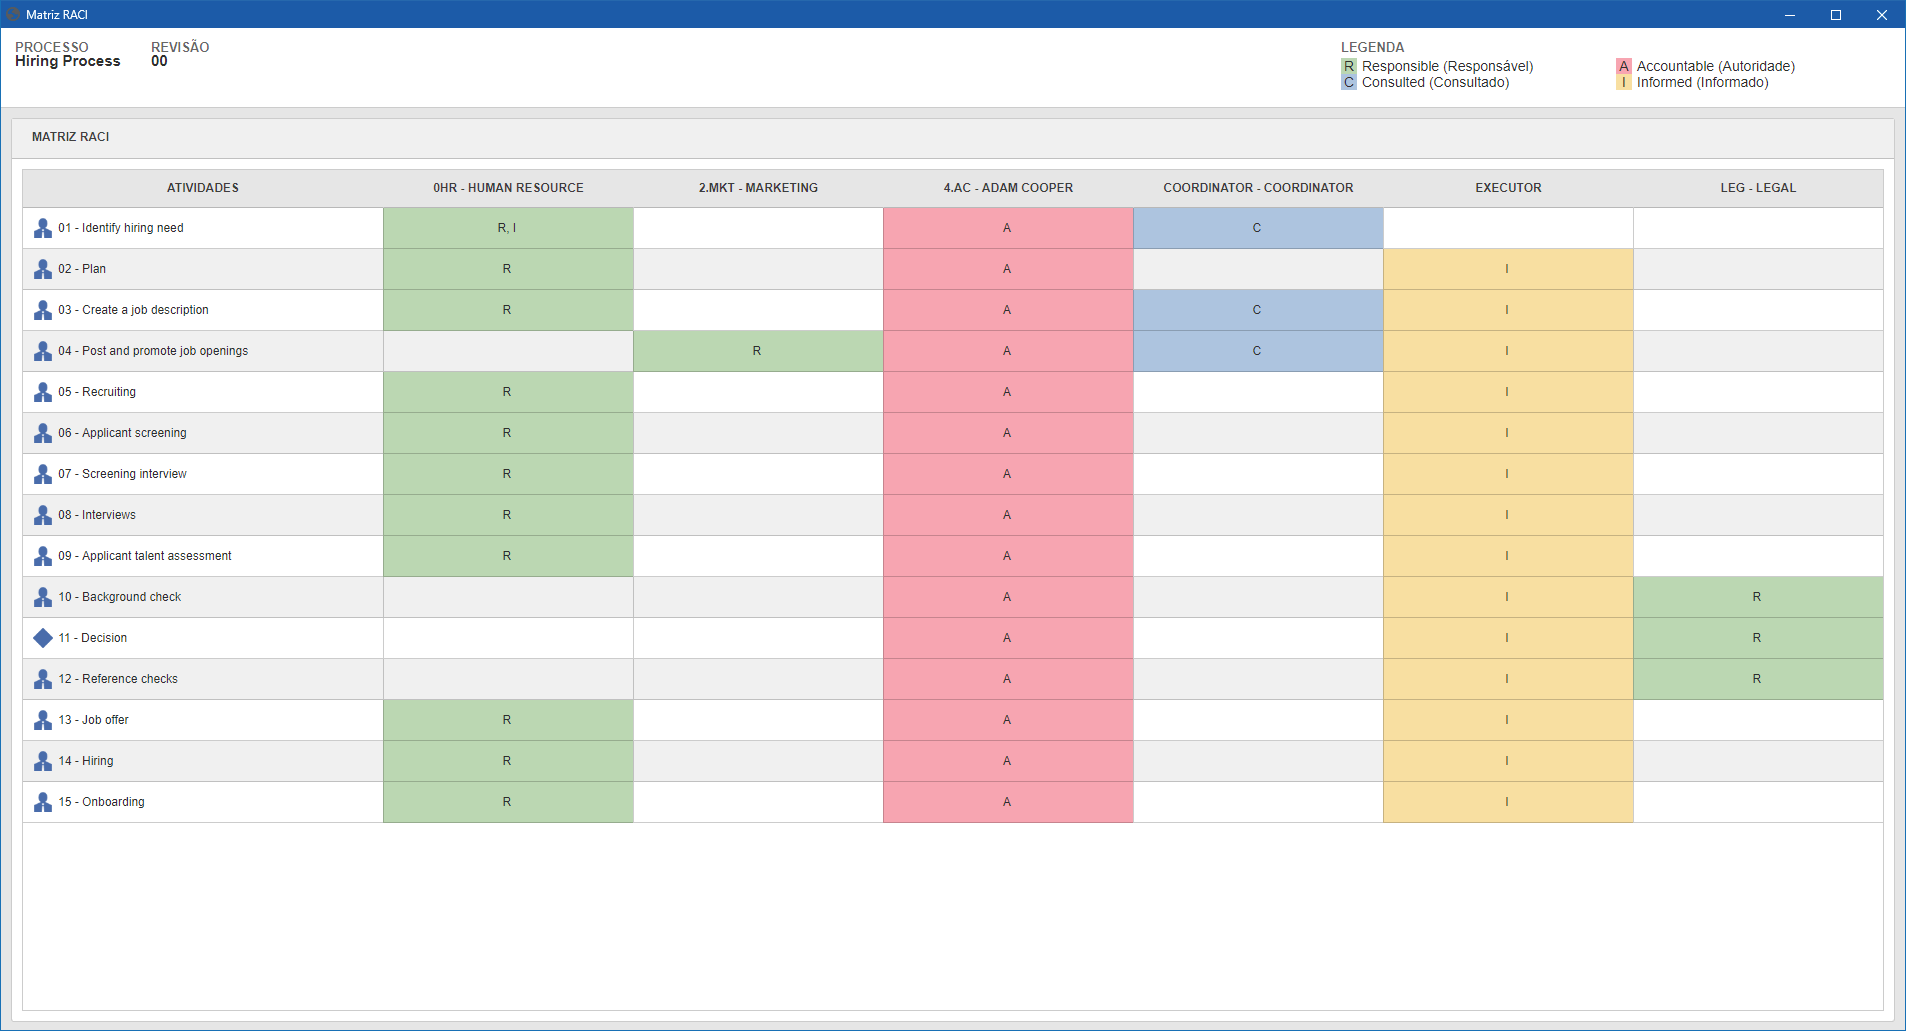
É inviável acompanhar o cronograma e gerir o escopo (e os entregáveis) sem que os membros da equipe tenham o devido conhecimento de suas responsabilidades no ciclo de vida do processo.
A matriz auxilia na gestão de recursos humanos durante o desenvolvimento do processo ao esclarecer os papéis a serem exercidos ao longo do tempo.
Com ela, é possível mapear todas as partes envolvidas, atribuindo funções para cada pessoa nas atividades a serem realizadas. A matriz RACI é formada por um acrônimo, que também define os papéis e as atribuições dos envolvidos:
| Responsible |
Grupo de pessoas (ou o indivíduo) responsável pela execução, pelo desenvolvimento, pela conclusão e pela entrega da atividade. No sistema: corresponde ao executor da atividade. |
| Accountable |
Corresponde à parte que tem autoridade para organizar a tarefa, acompanhar seu desenvolvimento e aceitar ou recusar formalmente uma entrega. O papel do accountable é o do aprovador, que será cobrado caso algo se desvie do esperado. Por isso, só deve haver uma autoridade por tarefa. No sistema: corresponde ao responsável pelo processo. |
| Consulted |
São todas as pessoas que podem dar dicas, opiniões e sugestões para melhorar o desenvolvimento da atividade ou aperfeiçoar o entregável. Elas devem responder aos questionamentos do responsável (responsible), que, por sua vez, deve envolver essas pessoas sempre que necessário para agregar valor ou esclarecer dúvidas relacionadas à tarefa em execução. No sistema: são os recursos humanos associados à atividade. |
| Informed |
São todas as pessoas que precisam receber a informação sobre a conclusão e o início de uma atividade (ou até de uma entrega) que gere uma mudança impactante no processo. No sistema: são os notificados da atividade. |
CMDB
O CMDB (Configuration Management Database), ou Banco de Dados do Gerenciamento de Configuração, é uma base de dados que reúne informações relevantes sobre os componentes de um sistema de informação. Ele é utilizado principalmente em serviços de TI da organização nas situações que exigem um acompanhamento detalhado do relacionamento entre os ativos e processos de negócio.
Após clicar com o botão direito do mouse sobre o processo, selecione a opção Abrir dados e, na tela que será aberta, clique no botão CMDB disponível na barra de ferramentas.
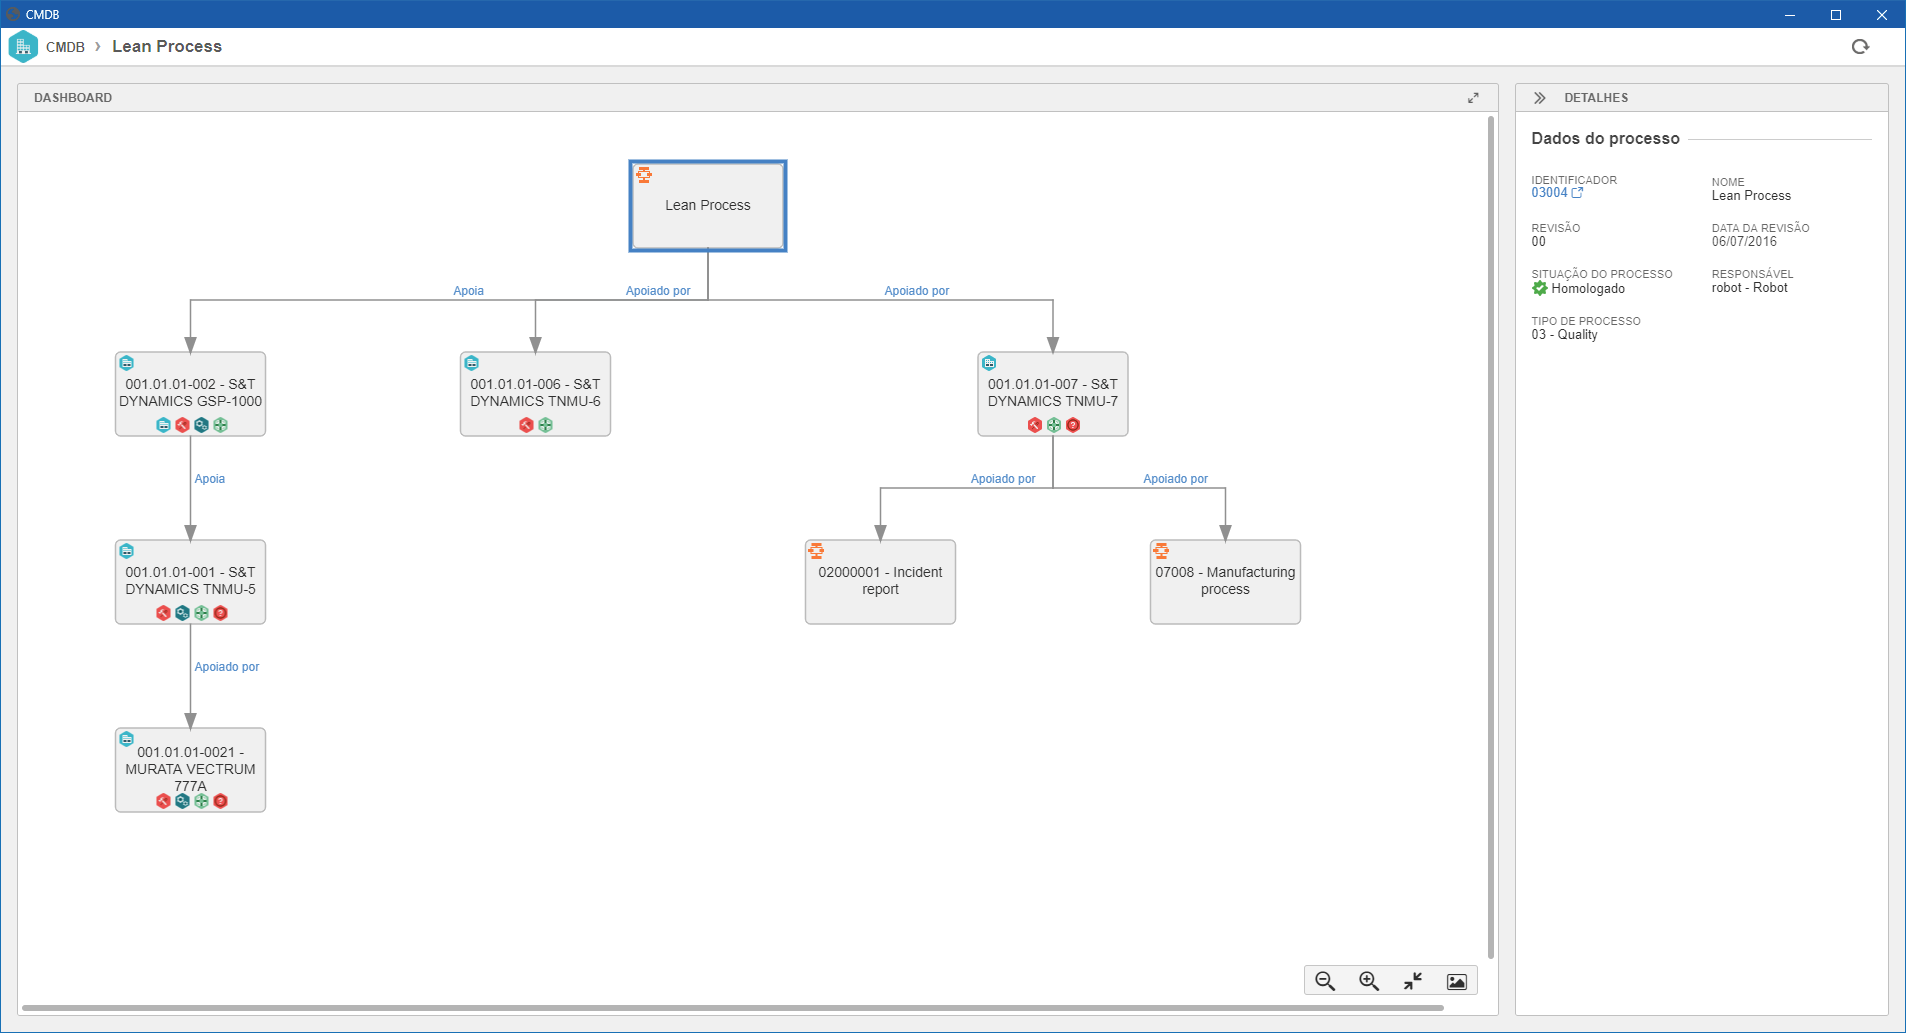
No SoftExpert Ativo, a estrutura de relacionamento do CMDB pode ser acessada por meio do botão  , localizado na barra de botões dos menus: Definição do ativo (AS016), Consulta de ativo (AS030) e Consulta de computadores (AS073).
A estrutura também pode ser visualizada no terceiro quadrante dos menus citados, através da opção Relacionamentos, disponível na tela de dados do ativo.
Análise de mineração de processos
A mineração de processos tem como objetivo oferecer uma análise detalhada dos processos de negócio, permitindo otimizar as operações com base nos registros de eventos.
Após clicar com o botão direito do mouse sobre o processo, selecione a opção Abrir análise de mineração de processos.
Para mais detalhes sobre a criação da análise, confira a documentação do SoftExpert Data lab.
A análise de mineração de processos somente estará disponível para clientes que utilizam a plataforma na nuvem SoftExpert e que possuem licença ativa do SoftExpert Data lab.
Conclusão
Agora você já sabe como consultar diversos tipos de dados dos processos registrados no sistema para deixar sua gestão ainda mais completa!