Manage the collection event log
This article is valid until version 2.1.9 of the system. Click here to access the documentation referring to later versions.
The collection event log records the nonconformities found in the collection, whether they are manually entered by the user or automatically recorded by the system.
To configure the collection event log, follow the steps below:
1st step: Configuring the event log rules
In this step, we will configure a rule for the event log of a collection, that is, when a sample violates this rule, the system will identify it and record an event in the event log.
This configuration can be performed in the SP019, SP003 or SP004 menus.
In this step, we will configure the event log for the "10mm screw" collection created in the Creating a collection topic.
To do that, access the Collection tracking (SP004) menu and, in the Quick search field, search for the created collection and click on the  .
.
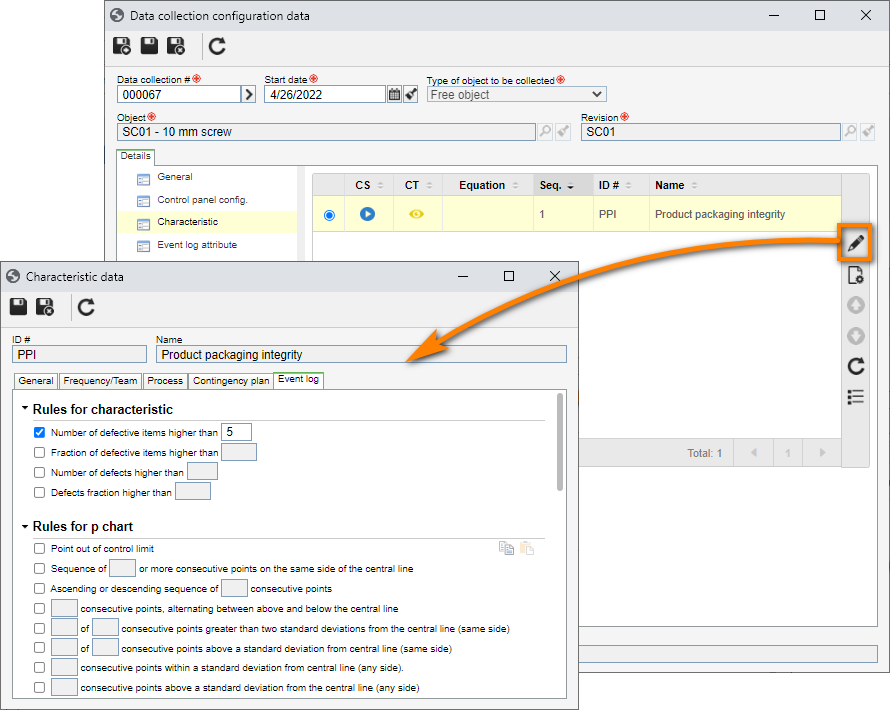
After that, select the Characteristic tab, search for the characteristic created in the Create a collection from SE PDM topic and click on the button.
On the characteristic data screen, click on the Event log tab, select the Number of defective items greater than rule and fill it out with the value 5.
Thus, if the entered number of defective items is greater than 5, the system will open an event log for that sample.
Once done, click on the  button.
Thus, we have successfully configured the event log rules!
2nd step: Manually creating an event log
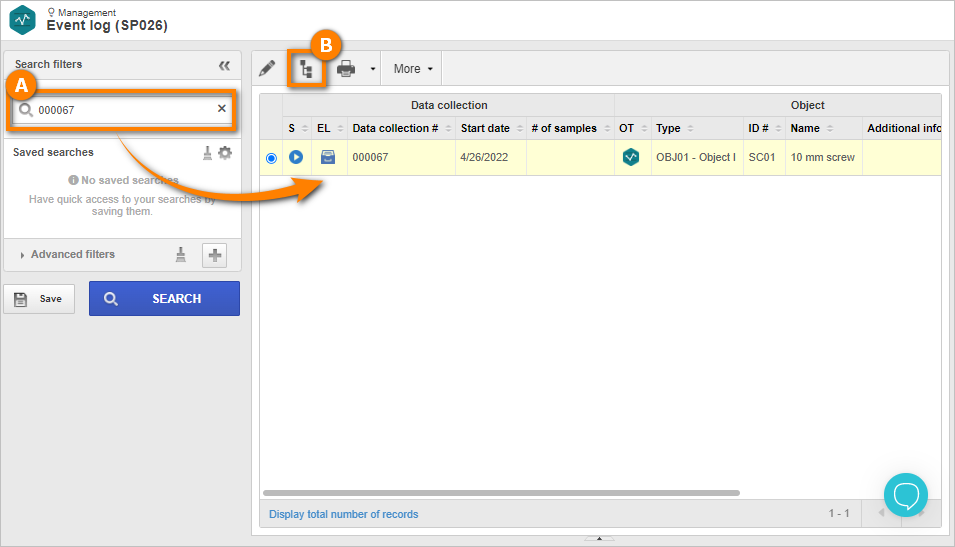
To manually create an event log, access the SP026 menu and search for the created collection.
Then, click on the arrow next to the More button and select the "3 quadrants" option.
On the third quadrant screen, click on the  button.
On the screen that will be opened, the Reason for calling field will be automatically filled out with "Manual call".
Then, enter the event log date, the number of the sample to which the event is linked, an occurrence, and an explanation.
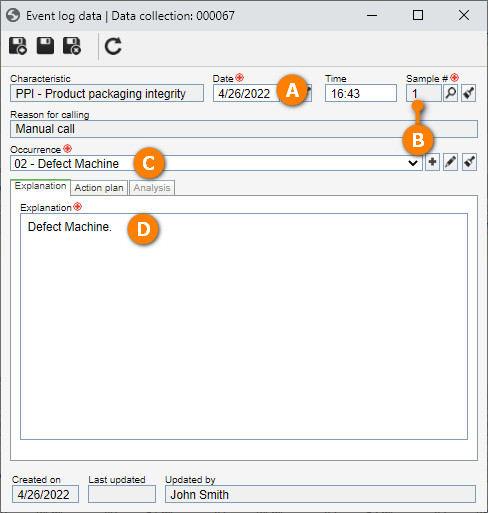
Fill out the data above and click on the button.
The manual event log has been recorded!
3rd step: Generating an automatic event log
In this step, we will add a sample that does not respect the rule configured in the first step.
To do that, keep the SP026 menu open and, in the Quick search field, search for the created "10mm screw" collection.
Then, click on the  button.
On the screen that will be opened, click on the Add option.
Then, on the data collection screen, fill out the data as indicated in the Adding values to a collection step; however, for this example, the Number of defective items field must be filled out with the value 6.
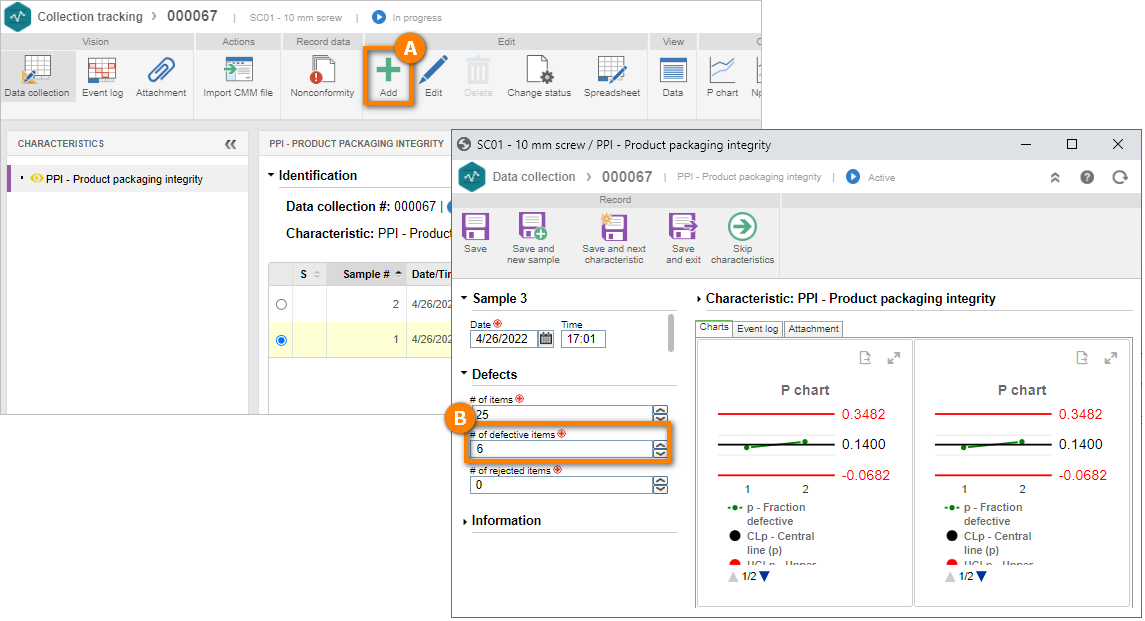
Once done, click on Save.
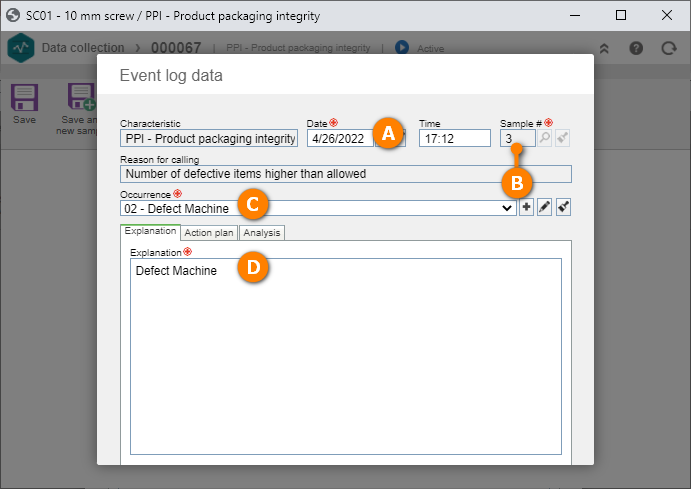
At this point, the event log data screen will be displayed.
Note that the Date and Sample number fields will be filled out by the system.
We can also note that the Reason field is filled out with the rule that triggered it, which, in this case, is the number of defective items higher than allowed.
Finally, select an occurrence and describe an explanation.
If there are no occurrences recorded, click on the button next to the field.
On the screen that will be opened, enter an ID # and a name for the occurrence and click on the button.
The automatic creation of events in the event log has been finished.
4th step: Creating a cause
To analyze an event log, we must have a previously created cause.
To do that, first, it is necessary to configure a cause type.
See how to perform this operation in the Creating a new cause type section of the SE Administration menu.
With the cause type duly created, we will create a cause.
Once done, access the SP025 menu, click on the button and, on the screen that will be opened, select the created cause type:
Then, click on the arrow next to the ID # field to automatically generate an ID # and enter a name for the cause.
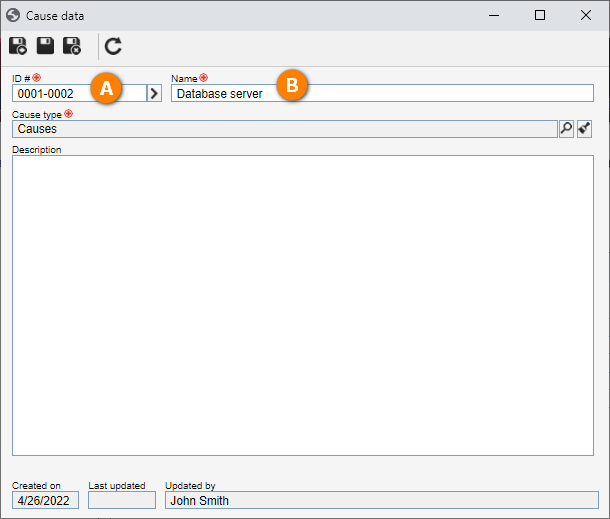
Once done, click on the button.
5th step: Analyzing an event log
With the cause duly created, we will analyze an event log.
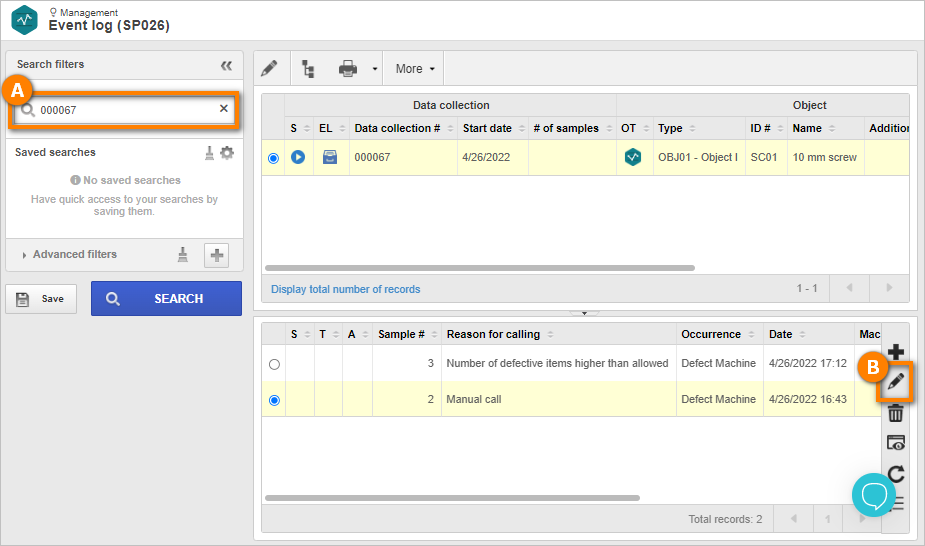
To do that, keep the SP026 menu open and, in the Quick search field, search for the created "10mm screw" collection created in the Create a collection from scratch topic.
With the record selected in the second quadrant, click on the button on the third quadrant toolbar.
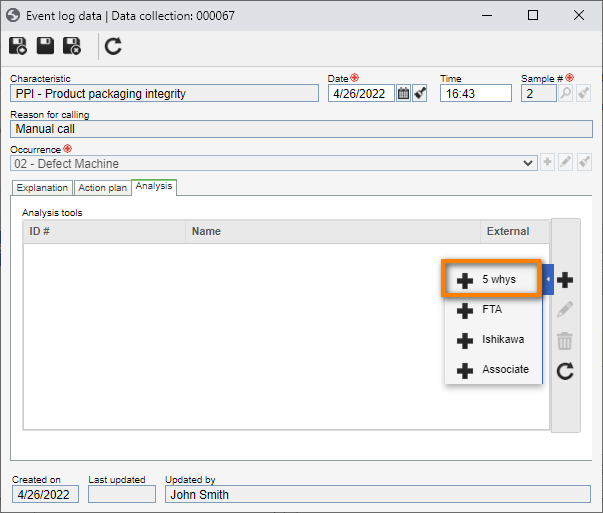
On the event log data screen, access the Analysis tab and click on the button.
Then, select the 5 whys option.
To use the analysis tool, it is necessary to have previously created causes.
See a detailed description on how to perform this operation in the Creating a cause topic.
With the causes duly created, drag them to each panel of the 5 whys tool:
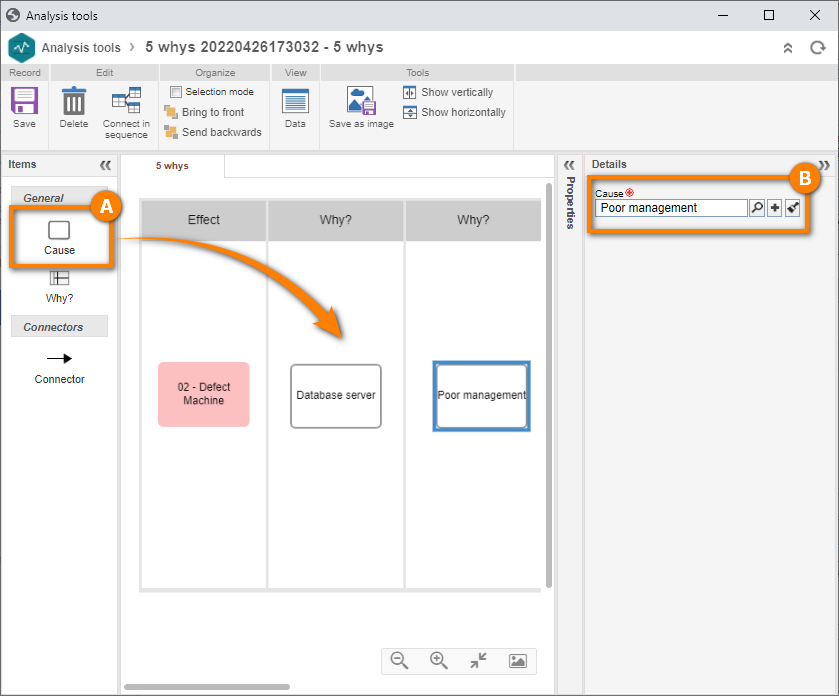
After completing everything, click on the Save button.
The event log analysis has been finished!