Simulate a process
This article is valid until version 2.1.9 of the system. Click here to access the documentation referring to later versions.
This topic will show you how to simulate a process.
A simulation aims to facilitate the identification of critical points. It also makes it possible to evaluate the behavior of the process with different costs, resources, etc.
As an example, we will use the purchase request process created in the previous topic.
To this end, simply follow the steps below:
1st step: Create simulation scenario
To create the simulation scenario, go to the PM022 menu; in the Quick search field, search for the "Purchase request" process, created in the previous topic.
Then, click on the  button.
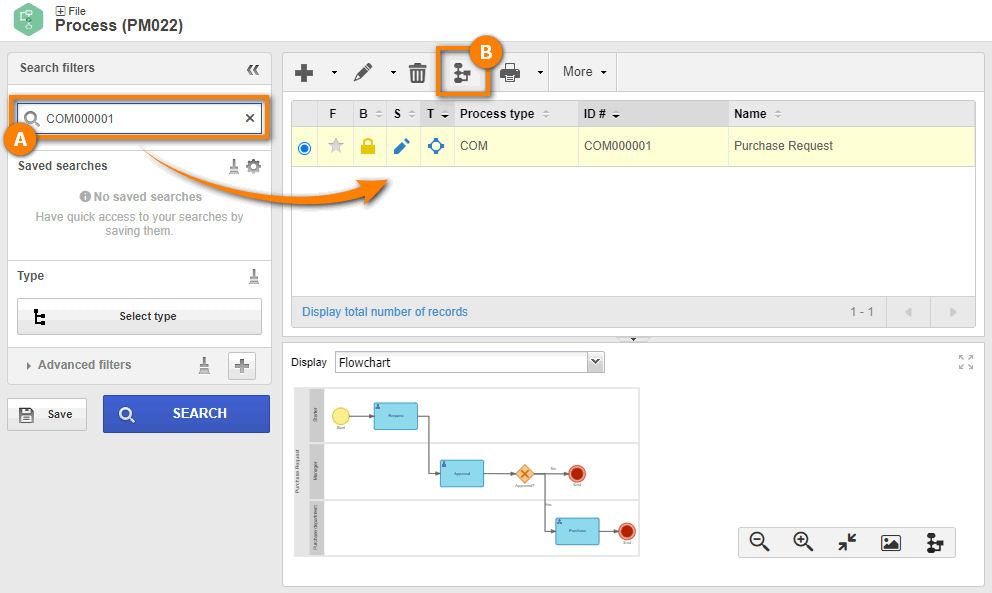
On the flowchart screen, click on the Simulation button to open the configuration screen of a scenario.
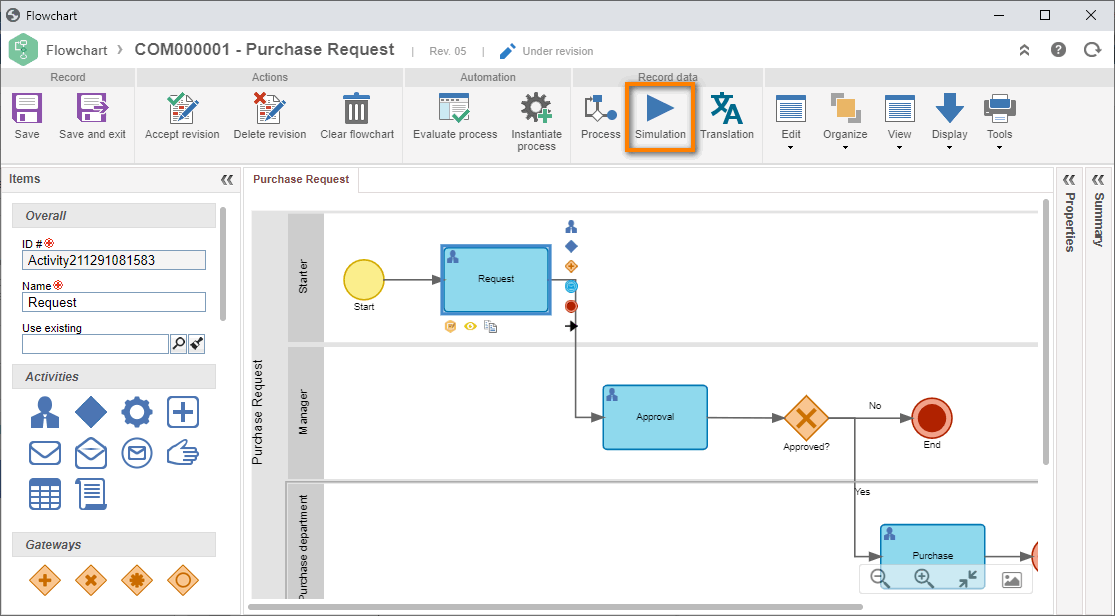
In the simulation panel, we will select the "Request" activity.
In the configuration panel, click on the  button to add the configurations referring to duration, execution and resources, as shown in the image.
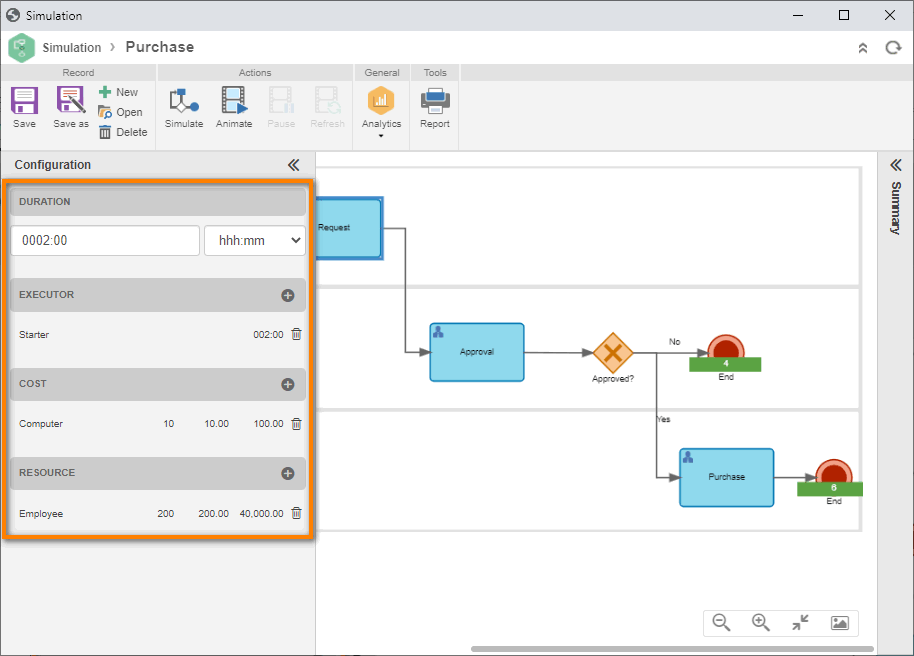
Any change made to the simulation will not affect the process, it is data used only to simulate the scenario.
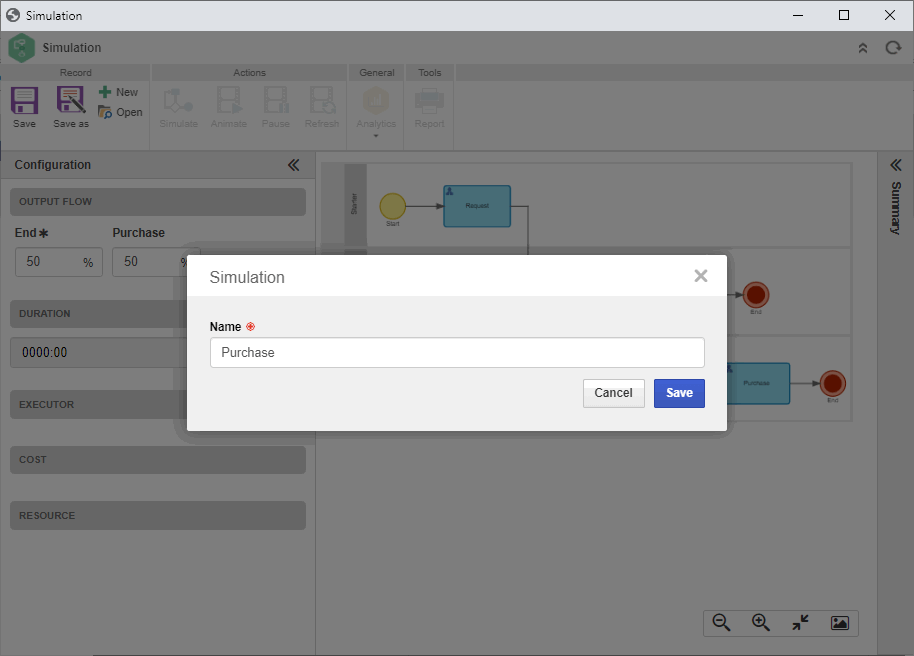
For the gateways, we will use the default 50% configuration for two route possibilities.
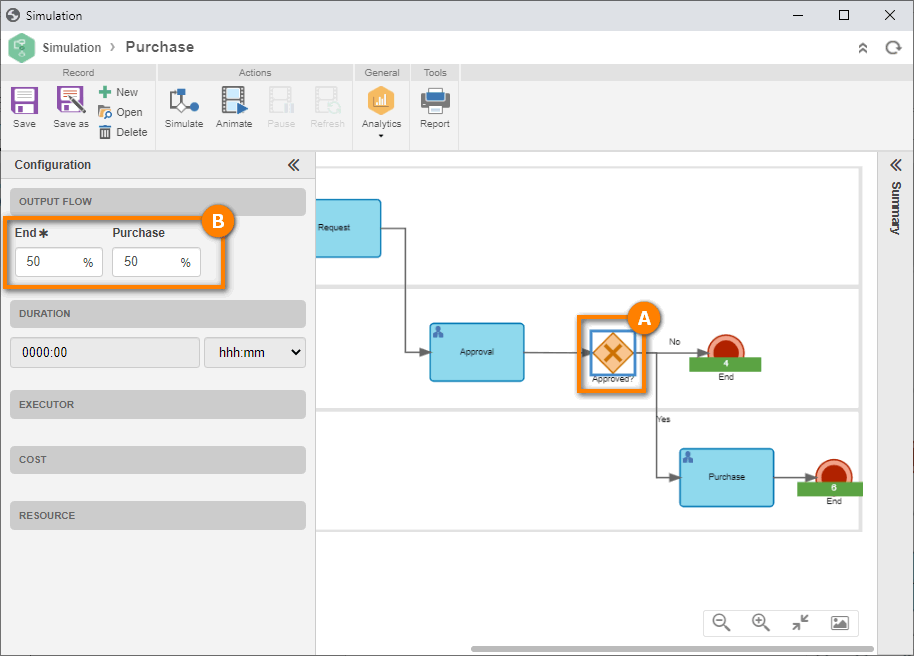
After configuring the scenario of each activity, click on the Save button.
Enter the name "Purchase simulation" for the simulation and click on the Save button again.
Done. We have successfully created a simulation scenario!
2nd step: Run simulation
With the scenario duly configured, we will start the simulation.
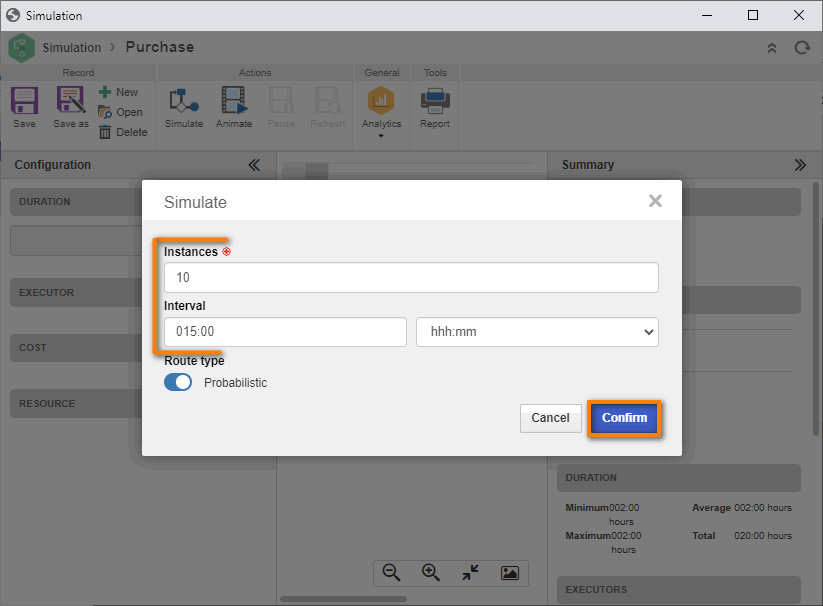
To do so, click on the Simulate button; on the screen that will open, enter "10" in the Instances field and add an interval of "15 hours" in between the starts.
After doing that, click on the Confirm button for the system to start the calculation.
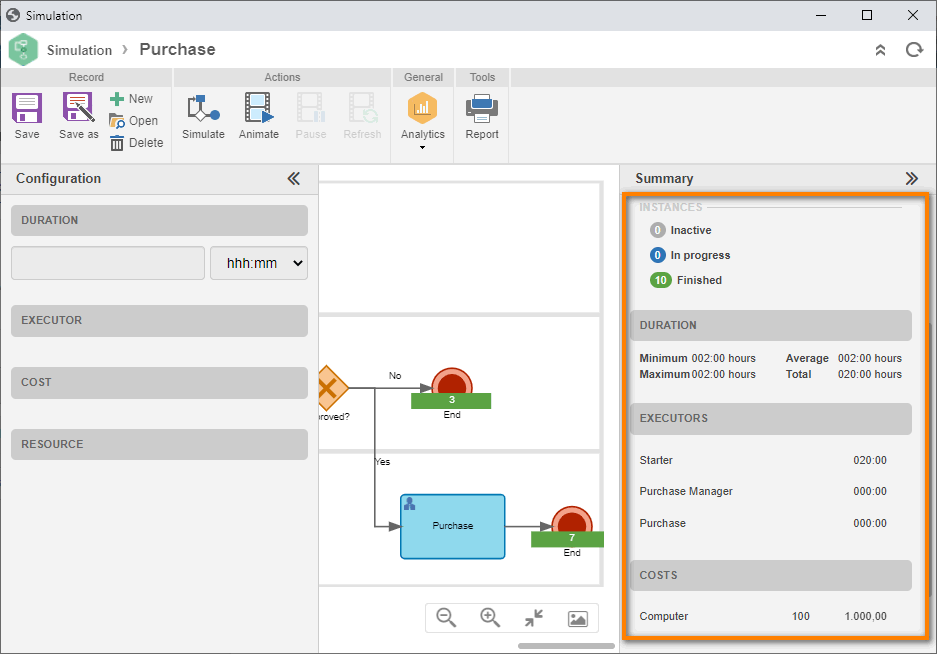
After the calculation is finished, the simulation summary panel will be shown.
In this panel, we can see the totals for duration, costs, resources, executors, and we can track the totals during the animation.
3rd step: Animate simulation
In this step, we will view the simulation animation.
To do so, keep the Execution speed field with "1 hour" and click on the Animation button.
During the animation, we can see the number of instances that are still to be started in the start item of the process.
And at the end point, we can check finished instances, activities in progress and instances to be started.
In this way, we have successfully concluded the simulation animation!
4th step: Generate simulation report
In this step, we will learn to view and analyze the simulation report.
To do so, click on the Report button.
On the process structure report screen, add the date/time on/at which the process report is being generated and, in the Calendar field, we will keep the default used by the system.
To do so, just leave the field empty.
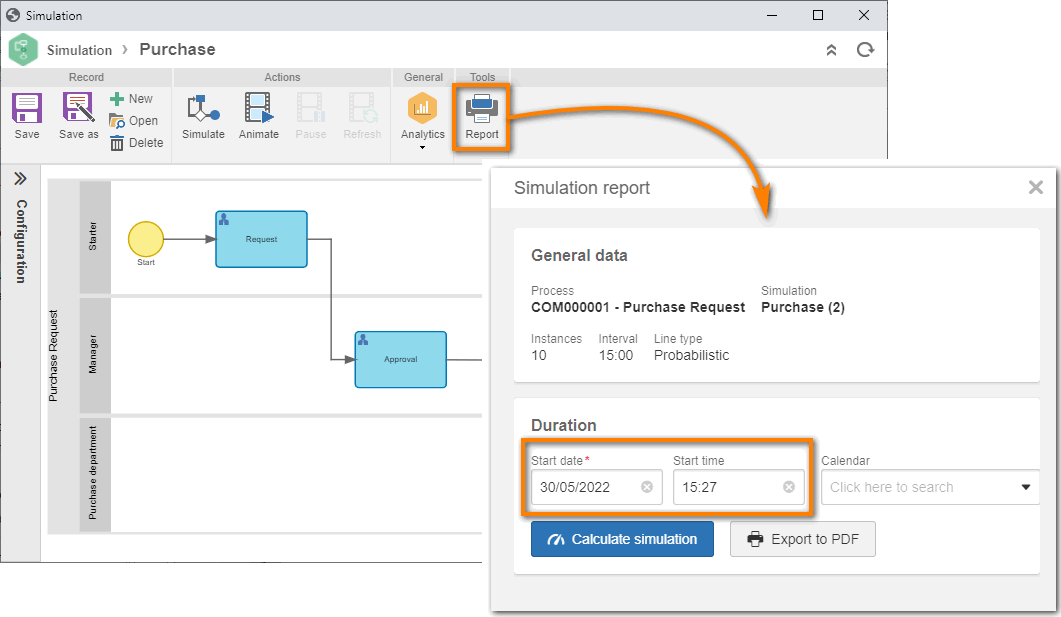
After doing that, click on the Calculate simulation button.
In this way, we will see the data of a timeline from a specific date.
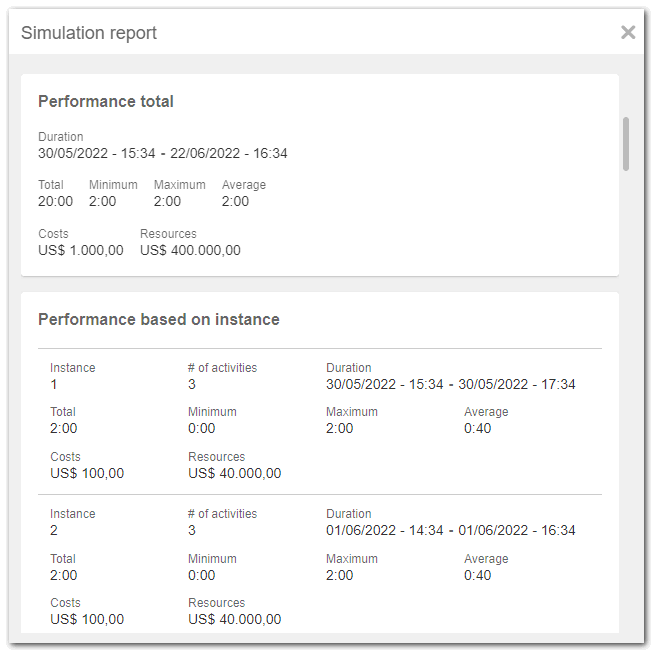
The system also shows the result for total and based-on instance performance.
In this way, we have successfully viewed the simulation report of our process!
5th step: Analyze simulation
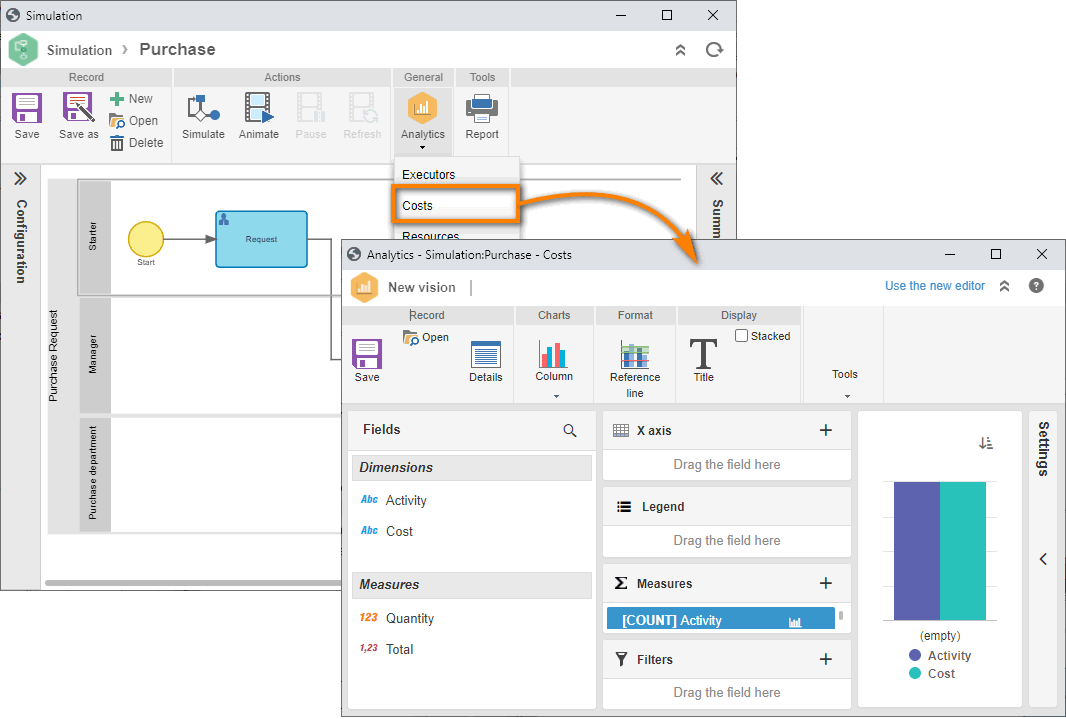
To generate the analyses, click on the arrow under the Analytics option and select the "Costs" option.
On the configuration screen of the SE Analytics vision, drag and drop the Quality and Total fields in the columns and measurements panel.
Then, click on the Column option to view the data in this type of chart.
Done. We have successfully finished the simulation analysis!