Configuring a view profile
 |
 |
Prerequisite
- Access to one of the following menus:
| SoftExpert SPC | Configuration > View profile (SP018) |
| SoftExpert Performance | Configuration > View profile (ST028) |
| SoftExpert Action Plan | Configuration > View profile (PL028) |
| SoftExpert Project | Configuration > View profile (PR052) |
| SoftExpert Risk | Configuration > View profile (RI212) |
Introduction
View profile data varies according to the component to which it belongs.
See how to configure view profiles in different SoftExpert Suite components:
SoftExpert SPC
When loading an SPC component chart, the system will check whether the user has a view profile containing the chart in question. If affirmative, the chart will be loaded according to the configurations set in the view profile; otherwise, the system will load the chart with its default formatting.
To configure a view profile in SoftExpert SPC, follow the steps below:
1. Access the Configuration > View profile (SP018) menu.
2. Click on the  button.
3. Enter an ID # and a Name for the profile.
4. Click on the  button to enable the other configurations.
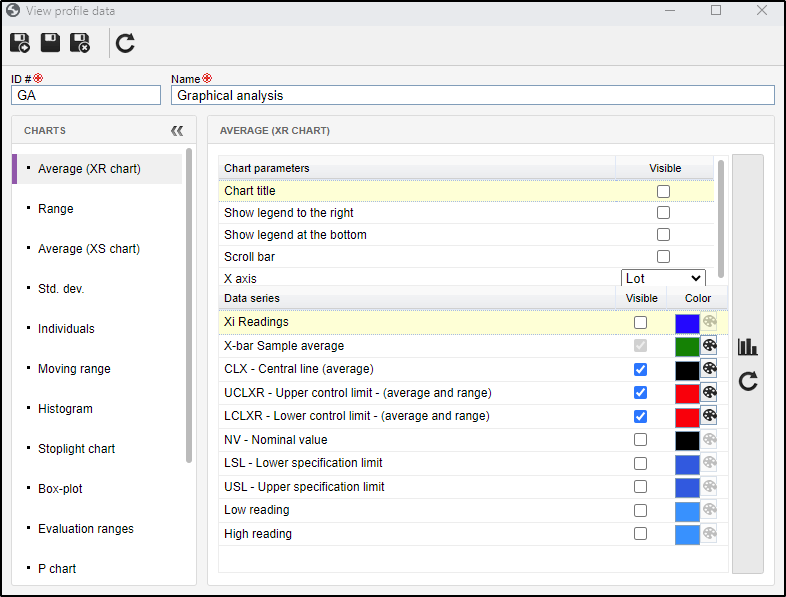
5. In the Charts panel, select the chart you wish to configure. At this point, on the right side of the screen, the system will load the data series of the selected chart. For each chart type, it will be possible to set the following configurations:
| Chart parameters | In the Visible column, check the items that will be displayed in the chart, such as the chart title, legend to the right or at the top, scroll bar in case of larger charts, etc. |
| Data series | In the Visible column, check the series that will be displayed in the chart. Use the Color column to define the color that will be used by the selected series. |
6. After configuring all required charts, click on the  button.
Use the  button on the profile data screen to view the chart customization. Upon clicking on this button, the system will display an example for the chart in question with the configurations set in the Chart parameters and Data series.
SoftExpert Performance
The view profile allows defining the set of information that will be displayed when the users access it: the Scorecard structure (in the Execution and View menus), the indicator result history, the indicator details, the element and/or scorecard, and the widgets related to SoftExpert Performance (Indicator/Element, My indicators, and Scorecard).
For further details on the view profile configuration in SoftExpert Performance, refer to the video below:
The Associated records tab will list the indicators, elements, scorecards, and portal widgets that use the view profile. The view profiles that have association can be identified by the "A" (Associated?) column, in the list of records on the main screen.
Configuring the data series of a chart
In the Chart and Accumulated chart tabs, by clicking on the  button, it is possible to configure the data series that will be displayed by the chart.
After clicking on the button, on the screen that will be opened, configure the following information:
| Option | Checked | Unchecked |
| Show measurement unit | The measurement unit used by the indicator will be displayed in the chart values. | The measurement unit used by the indicator will not be displayed in the chart values. |
| Display summarized hint | When hovering the mouse over the chart bars, only the value and the period will be displayed. | The hint will display the series name, the value, the period, and the range configuration. |
| Display range color as background | The ranges that compose the chart will be displayed in different colors in the chart background. The colors displayed in the chart range are those configured in the items of the range associated with the indicator. If the range values are variable, the background will only be displayed in colors for line and column type charts. | The range colors will not be displayed in the chart background. |
| Display color of the range in the chart bar | The chart bars will be displayed with the colors of the ranges that classify the values they represent. | The bars will be displayed with the colors set in the chart configuration. |
| Display period accumulation to the right | The accumulation of the current period is displayed to the right of the period values. | The accumulation of the current period is displayed to the left of the period values. |
| Display Indicator/Element name in chart title | The name of the element and/or indicator will be displayed in the chart title. | The name of the element and/or indicator will not be displayed in the chart title. |
| Display number of decimal places of the indicator | The number of decimal places configured in the indicator will be displayed. That is, the number of decimal places of the indicator will prevail over the number of decimal places defined in the chart configuration. | The values will be displayed with the number of decimal places configured in the chart. That is, the number of decimal places configured in the chart will prevail over the number of decimal places defined in the indicator. |
| Display additional fields value in hint | The chart series hint will also display the values of the additional fields of the indicator, if any. | The values of the additional fields of the indicators will not be displayed in the chart series hint. |
| Exclusive series for accumulations | Applies a different format to the accumulated and period values. | The accumulation values will be displayed in the same data series as the period values, with the same format in the chart. |
| Option | Checked | Unchecked |
| Accumulation | The information related to the accumulation will be displayed. The following fields will be available: • # of years: enter the number of years preceding the current year, whose accumulation values must be shown on the chart. If the number 1 is entered, the current year's accumulation values will be presented. • Columns: select the option corresponding to the accumulation information that should be displayed in the chart: Measurement, Target, or Target + Measurement. |
The information related to the accumulation will not be displayed. |
| 2nd Accumulation | The information related to the 2nd accumulation will be displayed. The following fields will be available: • # of years: enter the number of years preceding the current year, whose 2nd accumulation values must be shown on the chart. If the number 1 is entered, the current year's 2nd accumulation values will be presented. • Columns: select the option corresponding to the 2nd accumulation information that should be displayed in the chart: Measurement, Target, or Target + Measurement. |
The information related to the 2nd accumulation will not be displayed. |
| Period | The information related to the indicator period will be displayed. The following fields will be available: • # of years: enter the number of years preceding the current year, whose period values must be shown on the chart. If the number 1 is entered, the current year's period values will be presented. • Columns: select the option corresponding to the period information that should be displayed in the chart: Measurement, Target, or Target + Measurement. |
The information related to the period will not be displayed. |
SoftExpert Action Plan
The view profile allows defining the set of information that will be displayed on the action plan data screens.
To configure a view profile in SoftExpert Action Plan, follow the steps below:
1. Access the Configuration > View profile (PL028) menu.
2. Click on the button.
3. Enter an ID # and a name for the profile.
4. Click on the button to enable the other configurations.
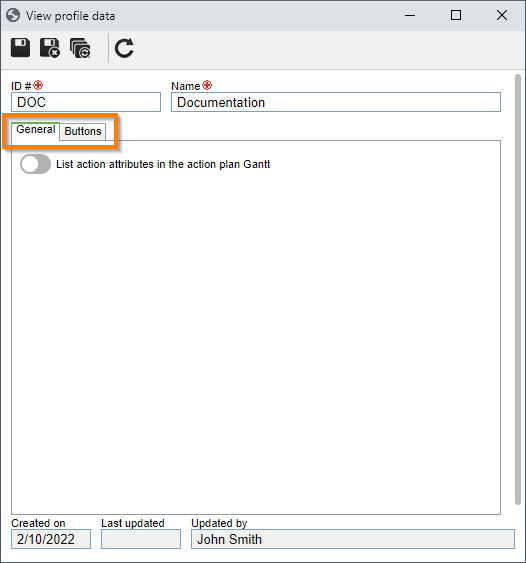
5. If necessary, in the General tab, enable the List action attributes in the action plan Gantt option.
By enabling this option, the action plan will display the action attributes at the end of the Gantt chart, on the action plan data screen. If this feature is disabled, the attribute values can only be accessed on the action data screens, in the Summary section, or through the view menu.
It is important to point out that:
• This is a view-only feature and it is not possible to edit the attributes via Gantt.
• It will not be possible to sort the attribute columns or customize them through the Gantt column configurator.
• Attributes will not be exported on the action plan action spreadsheet.
6. In the Buttons tab, check the information that must be displayed on the object data screen. Uncheck the information that must not be displayed on the object data screen.
Action plans / Templates / Isolated actions: respect the view profile configuration defined in their own categories.
Plan actions / Template actions: respect the view profile configuration defined in the action plan/template categories.
SoftExpert Project
The view profile allows defining the set of information that will be displayed when the users access SoftExpert GanttChart or the schedules of a project, portfolio, or program.
For further details on the view profile configuration in SoftExpert Project, refer to the video below:
• According to the object selected in the Object field, the options displayed in the Vision and Token may vary.
• For the view profile to be configured correctly, it is required to add at least one Vision.
• If changes are made to the configurations of a Vision (for example, some columns are parameterized to no longer be displayed), they will be duplicated in the projects/programs/portfolios of the type with which the profile is associated, when a new project/program/portfolio is added, or when visions are restored.
• In the Gantt chart field on the Parameters tab of the Vision, the Display critical path option will only be shown if the view profile object is a project.
SoftExpert Risk
The view profile allows defining the set of information that will be displayed when the user accesses the screens of the planning, monitoring, and viewing menus and the widgets related to SoftExpert Risk.
This configuration allows defining the information that will be seen within the structure of a risk plan; it is possible to define which pieces of information are relevant to be viewed in each situation.
For further details on the view profile configuration in SoftExpert Risk, refer to the video below:
The view profiles that have association can be identified by the A (Associated?) column, in the list of records on the main screen.
Conclusion
Thus, the view profile has been successfully configured. The next step is to associate it with the object.