Analyzing an event log
 |
 |
 |
 |
 |
Prerequisites
- Access to the Management > Event log (SP026) menu.
- Executed data collection.
- Event log recorded for the collection.
Introduction
To analyze the causes that have led to the generation of an event log, the system makes a series of tools available, Below, see each one of these options and what they are used for:
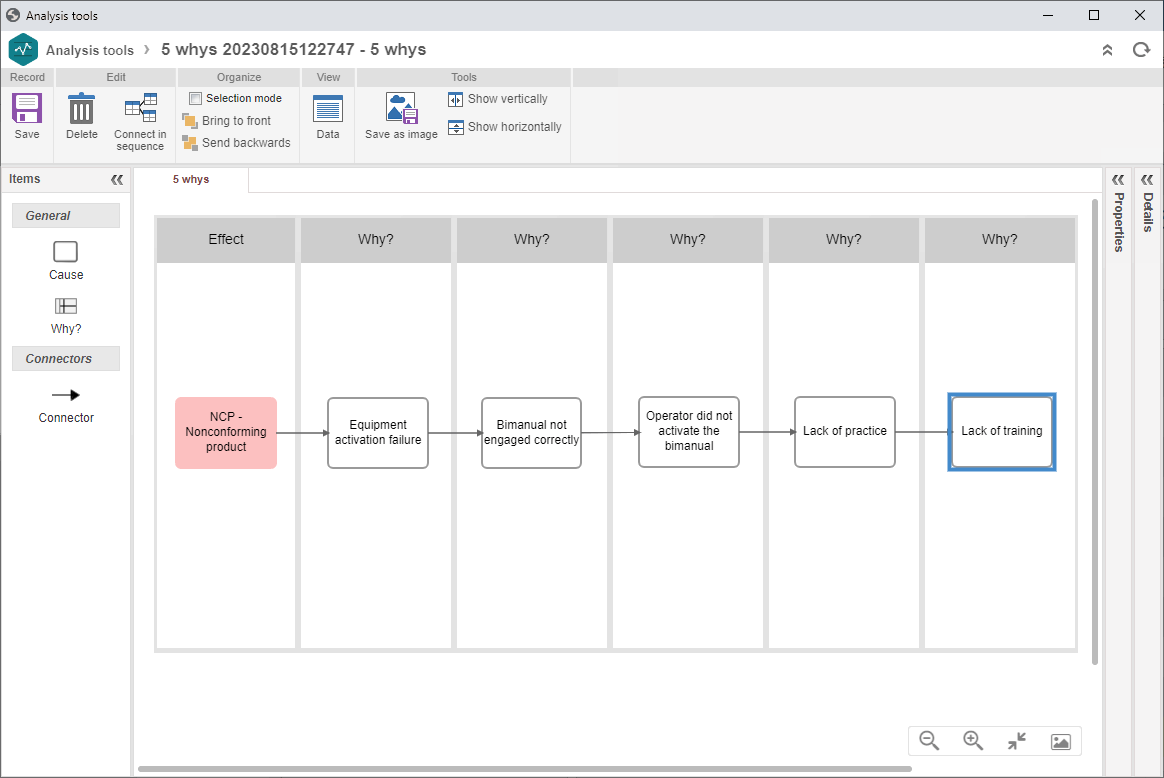
5 Whys
This technique allows for recording how a root cause was found, using successive questions.
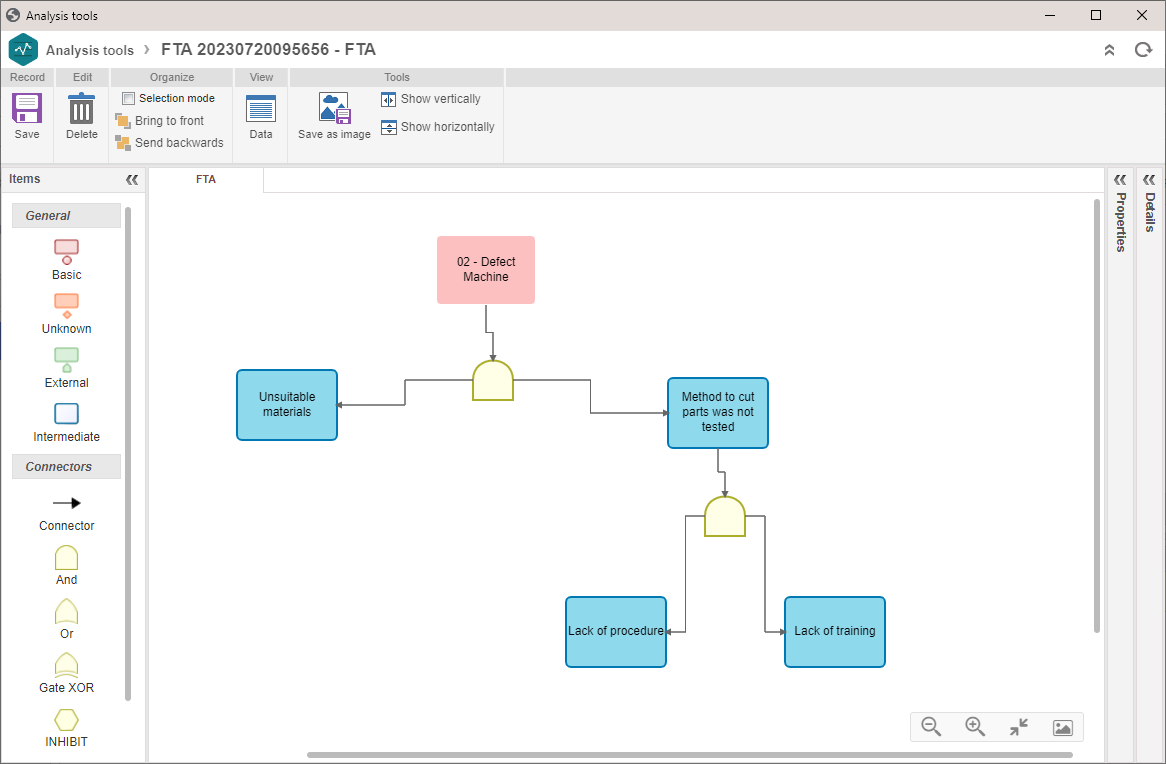
FTA (Fault Tree Analysis)
This tool involves a deductive logical process in search of all combinations of root causes that can lead to the occurrence of the unwanted event.
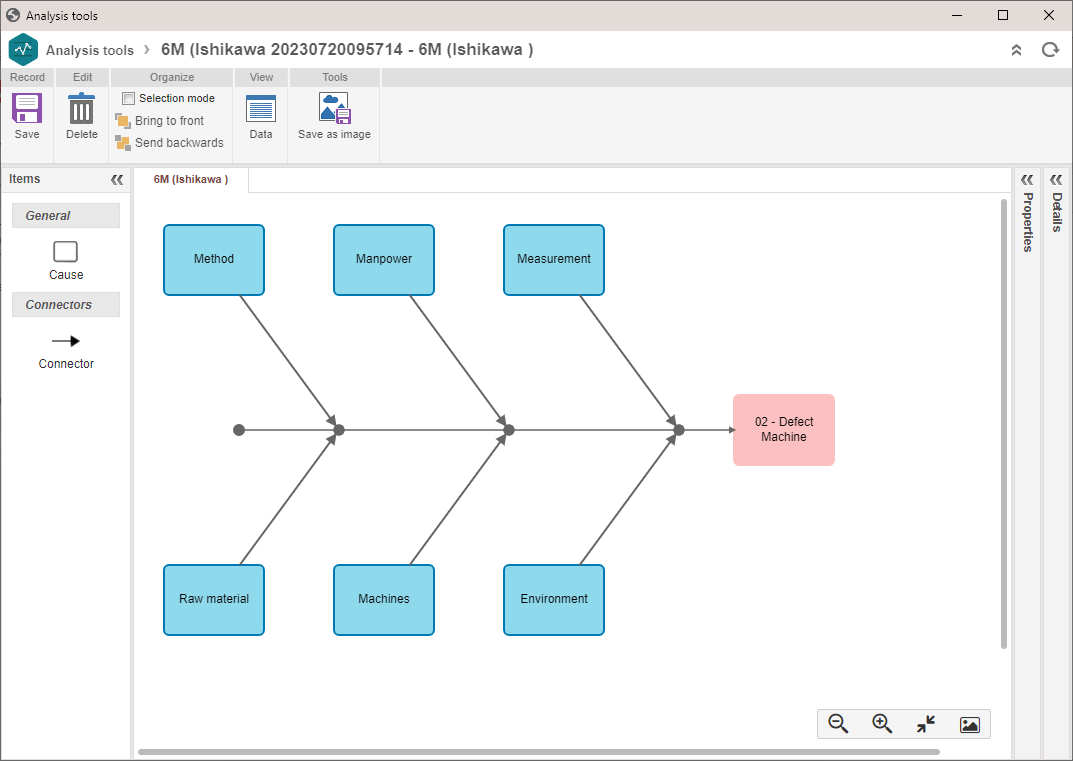
Fishbone or Ishikawa diagram
This tool, also known as Cause and effect diagram, starts from a "problem" (considered as the diagram effect) and from all of its influences (considered as the diagram causes). The identified effect and causes are arranged in the shape of a fishbone, which makes for easier visualization, in order to analyze the relationship involving all causes and how the effect (problem) can be solved.
See the steps for analyzing an event log:
Analyzing an event log
1. Access the Management > Event log (SP026) menu.
2. Expand the More button and click on the 3 quadrants option.
3. Select a data collection and, in the 3rd quadrant, click on the  button.
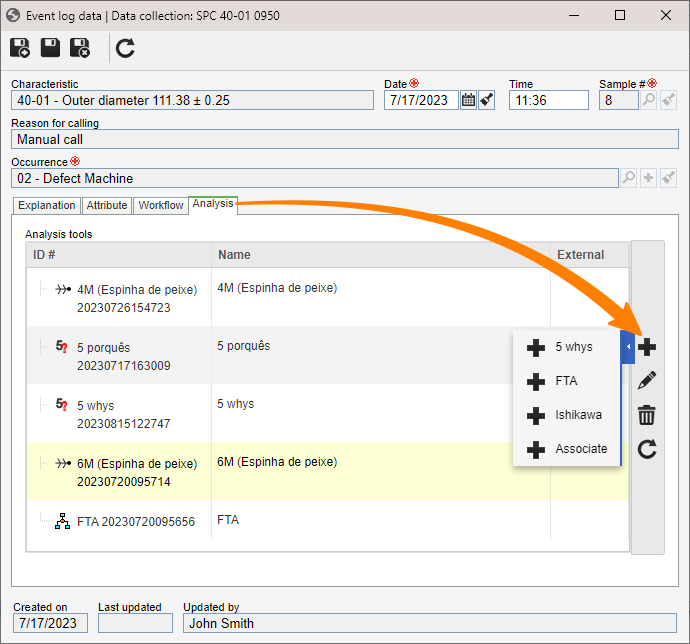
4. On the event log data screen, access the Analysis tab.
5. Expand the  button and select the desired tool.
6. After configuring the tool, click on the  button.
As of version 2.1.09, SoftExpert SPC considers the user's browser, no longer the server's time, to record the time of both the data collection sample and the event log.
Conclusion
After analyzing the causes that led to an event recorded in the event log, it is possible to perform a planning to easily find the appropriate solutions. Thus, the cycle of the collection event log is now complete.