How to use the Gantt chart
Prerequisites
- Configured workspace.
- Access to the Board and backlog (KN008) menu.
Introduction
The Gantt chart provides the manager with a time-based view of all tasks, simplifying their distribution on the calendar and among their assignees.
See how to use this feature:
How to use the Gantt chart
1. Access the Backlog screen from the Vision section of the Board and backlog (KN008) menu.
2. Select the workspace in which you want to use the Gantt chart.
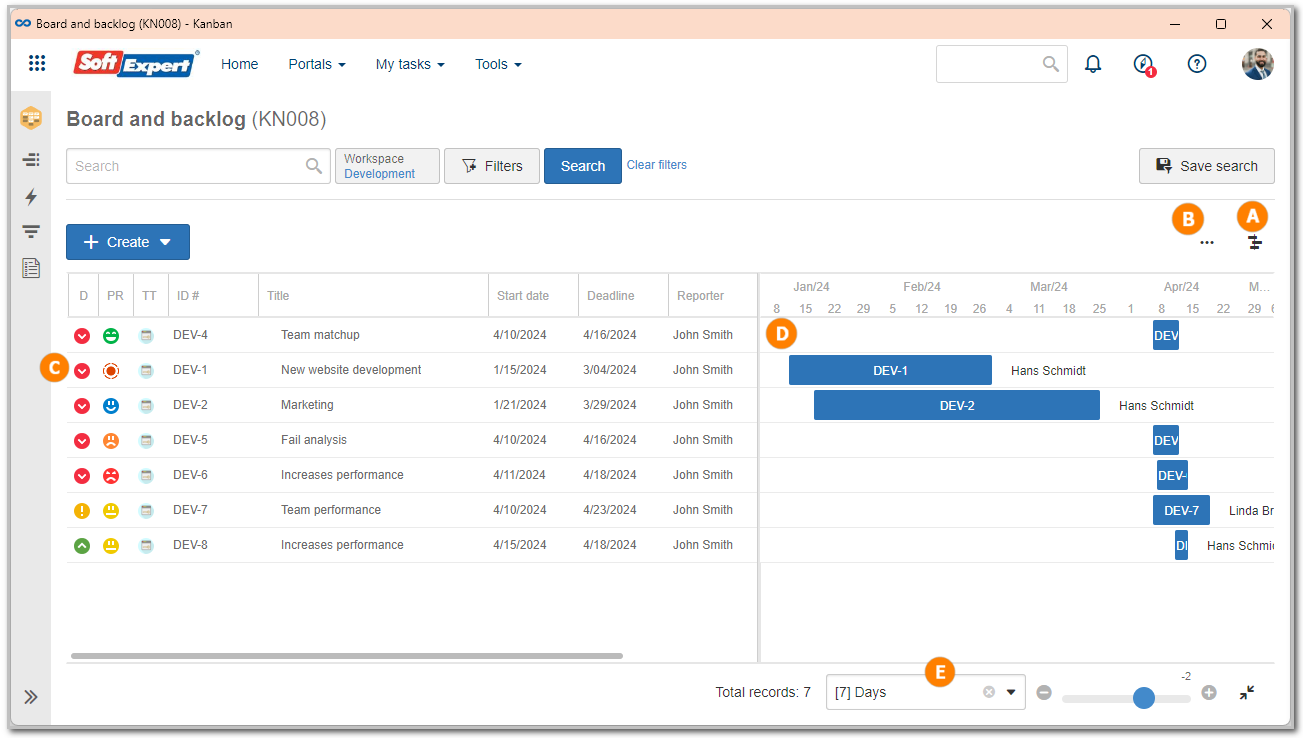
3. Click on the button that changes the display of the Backlog screen, identified by the letter A in the image below.
4. The screen will be shown with the Gantt chart and the following resources:

A — Buttons that allow switching between the backlog list and Gantt chart visions.
B — Allows for organizing the displayed tasks by different types of groupers, such as Assignees, Board lanes, Sprints or Initiatives, or simply by following the sequence of the backlog tasks.
C — List of tasks that are part of the workspace. This list contains the details of the tasks, such as ID #, priorities, planned dates, assignees, etc.
D — Displays the Gantt chart of the tasks shown on the list (C), in which it is possible to track the progress of the workspace tasks.
Each bar means an execution period referring to a task assigned to a user; the green ones have been executed, whereas the blue ones have not yet been closed or executed.
For tasks that have not been closed (blue bar), the manager can adjust their dates by clicking on and dragging their bar to the intended period. It is also possible to make the task deadline longer or shorter by clicking on the border of the blue bar and dragging it forward or backward on the calendar.
E — Allows for changing the period used to display the tasks in the chart. To do that, simply click on the field and select the intended period. For example, it is possible to monitor the progress of the tasks separately every 7 days, every 12 days, by Quarter, by Semester, etc.
Conclusion
By means of the Gantt chart vision, it is possible to better analyze the progress of the tasks contained in the workspace.