Analizar cuaderno de bitácora
 |
 |
 |
 |
 |
Prerrequisitos
- Acceso al menú Gestión > Cuaderno de bitácora (SP026).
- Toma ejecutada.
- Cuaderno de bitácora registrado para la toma.
Introducción
Para analizar las causas que han generado un registro de eventos en el cuaderno de bitácora, el sistema proporciona una serie de herramientas. Vea, a continuación, cada opción y para qué son utilizadas:
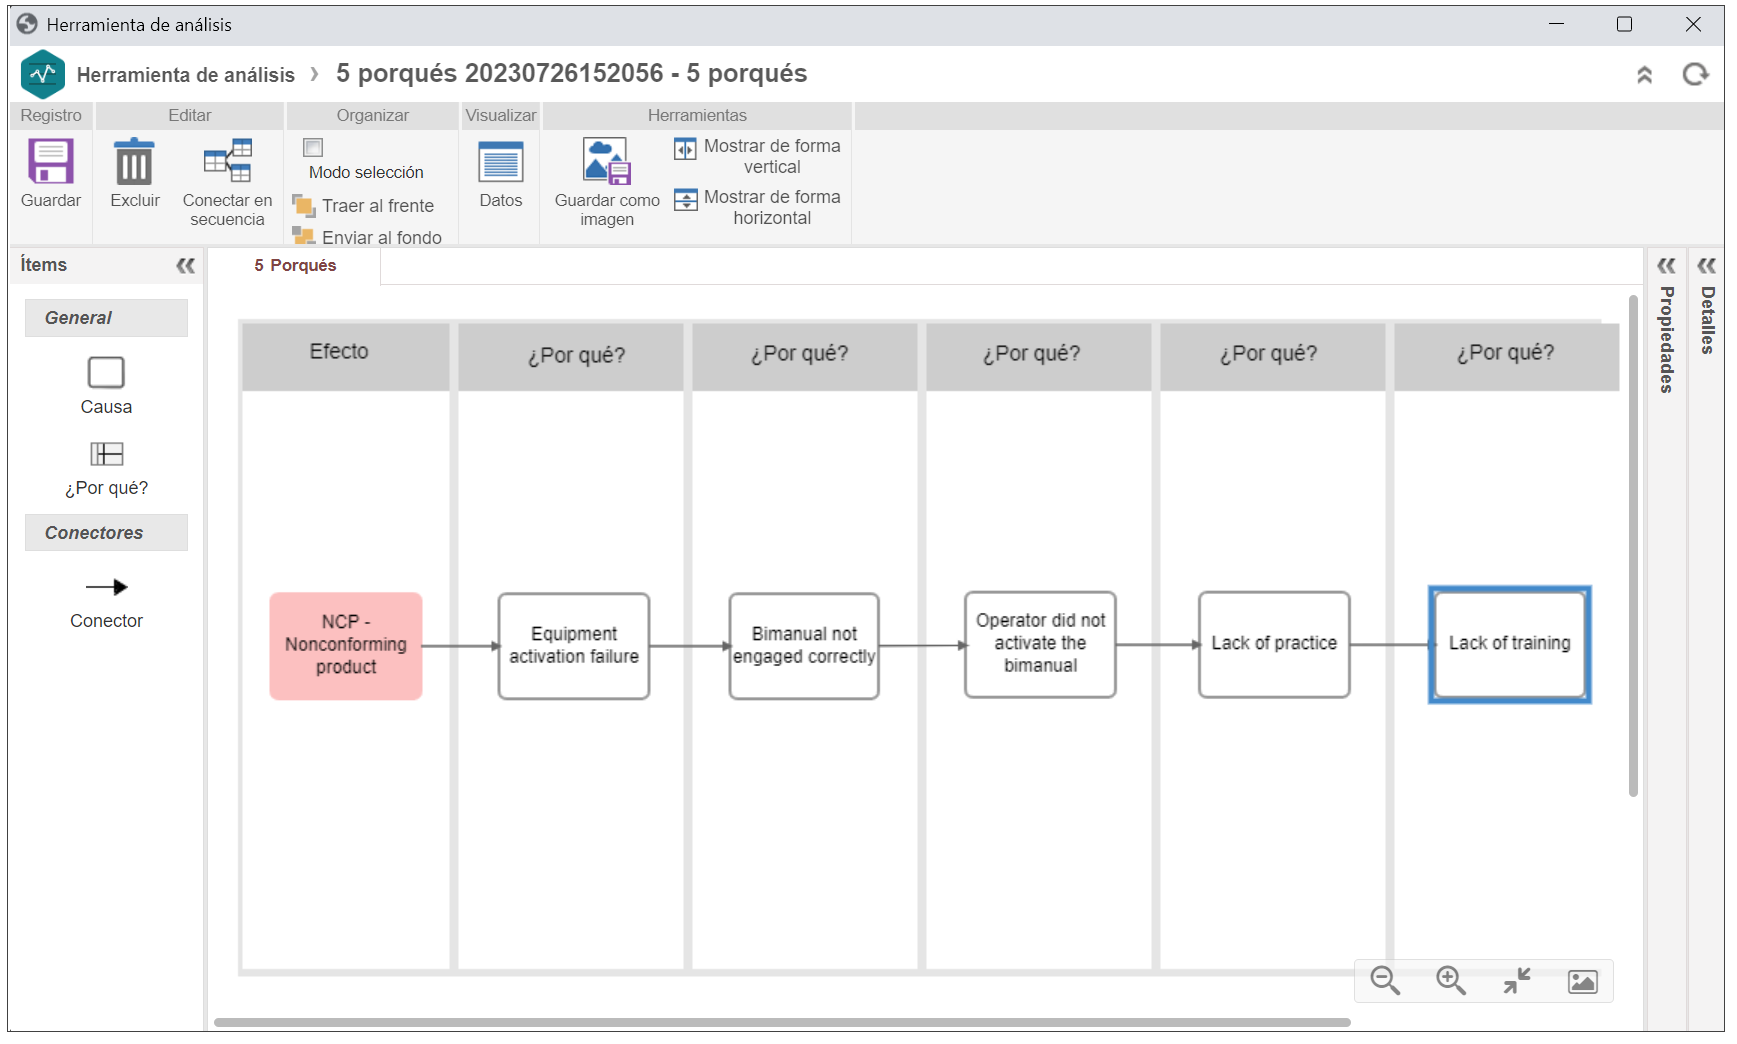
5 Porqués
Esta técnica permite registrar cómo se llegó a una causa raíz a partir de preguntas sucesivas.
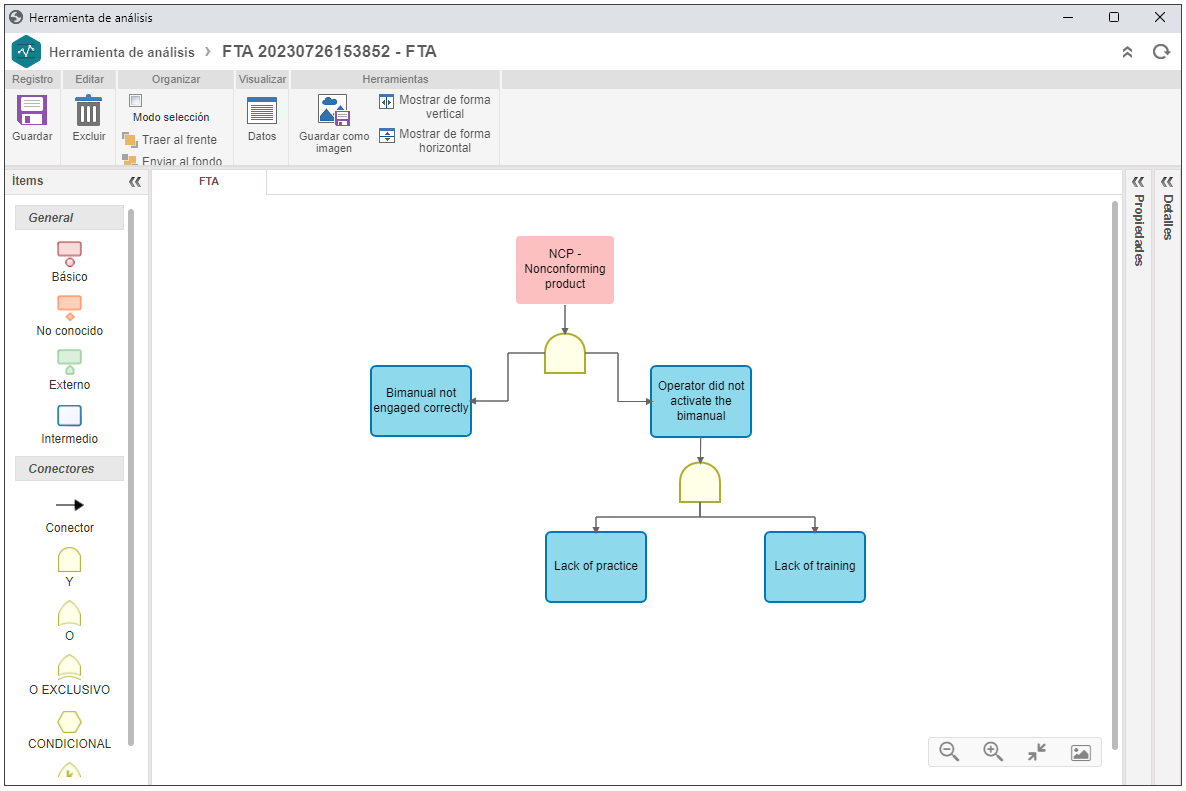
FTA (Fault Tree Analysis) o Diagrama del Árbol de Fallas
Esta herramienta involucra un proceso lógico deductivo, buscando todas las combinaciones de causas raíz que pueden llevar a la ocurrencia del evento no deseado.
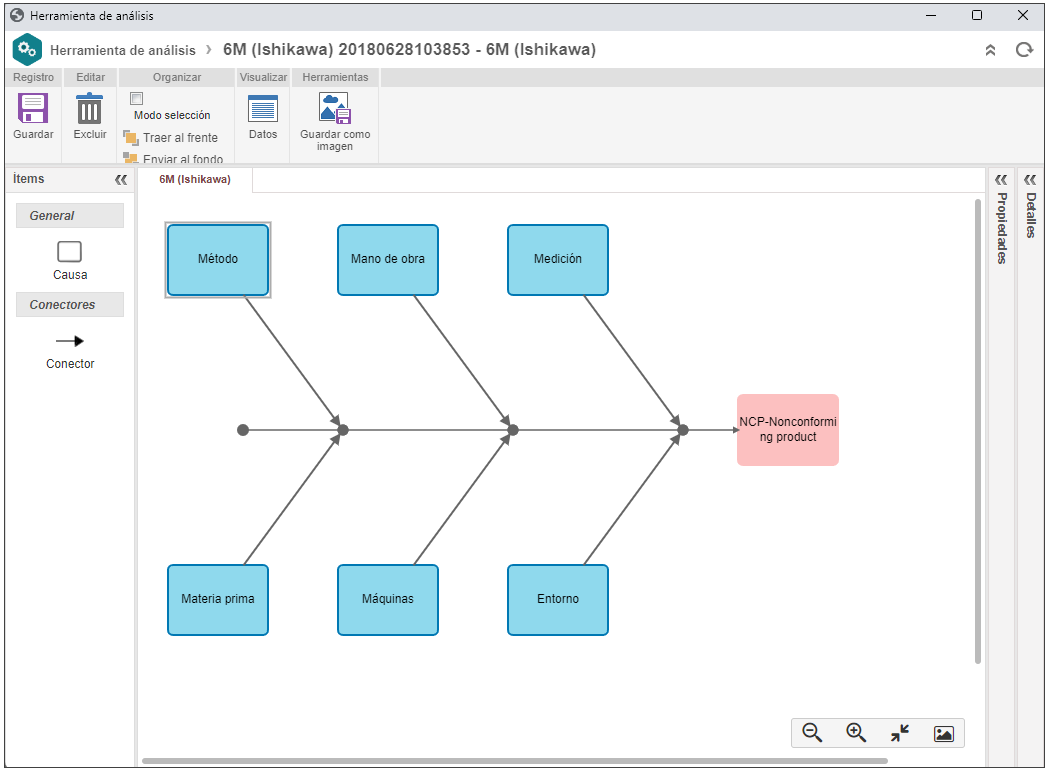
Espina de pescado o Diagrama de Ishikawa
Esta herramienta, también conocida como Diagrama de causa y efecto, parte de un "problema" (considerado como el efecto del diagrama) y de todas sus influencia (consideradas como las causas del diagrama). El efecto y las causas identificadas se colocan en forma de espina de pescado, lo que facilita la visualización de la relación entre todas las causas y cómo puede resolverse el efecto (problema).
Vea el paso a paso para realizar el análisis de un cuaderno de bitácora:
Analizar el cuaderno de bitácora
1. Acceda al menú Gestión > Cuaderno de bitácora (SP026).
2. Expanda el botón Más y haga clic en la opción 3 cuadrantes.
3. Seleccione una toma y, en el tercer cuadrante, haga clic en el botón  .
.
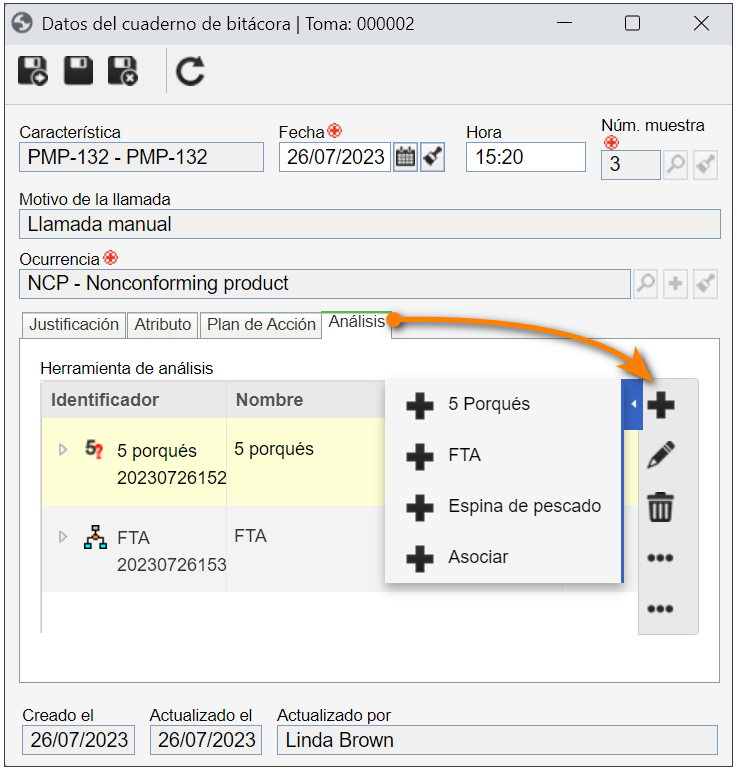
4. En la pantalla de datos del cuaderno de bitácora, acceda a la pestaña Análisis.
5. Expanda el botón  y seleccione la herramienta deseada.
6. Tras configurar la herramienta, haga clic en el botón  .
.
A partir de la versión 2.1.09, SoftExpert CEP registra la hora de la muestra de la toma y del cuaderno de bitácora con base en el navegador del usuario en lugar de la hora del servidor.
Conclusión
Después de analizar las causas que llevaron a un evento registrado en el cuaderno de bitácora, es posible realizar una planificación para encontrar fácilmente las soluciones adecuadas. De este modo, tenemos el ciclo completo del cuaderno de bitácora de la toma.