Analytics - 2.2.2
If there is any customized report that should appear on the unified menus, contact your account manager. It may be necessary to make adjustments to the report in order for it to be displayed correctly.
Unified File, View, and Management interface
Several SoftExpert Suite components have integrated their File, View, and Management menus, which results in faster and more direct access and eliminates the need to switch between different screens.
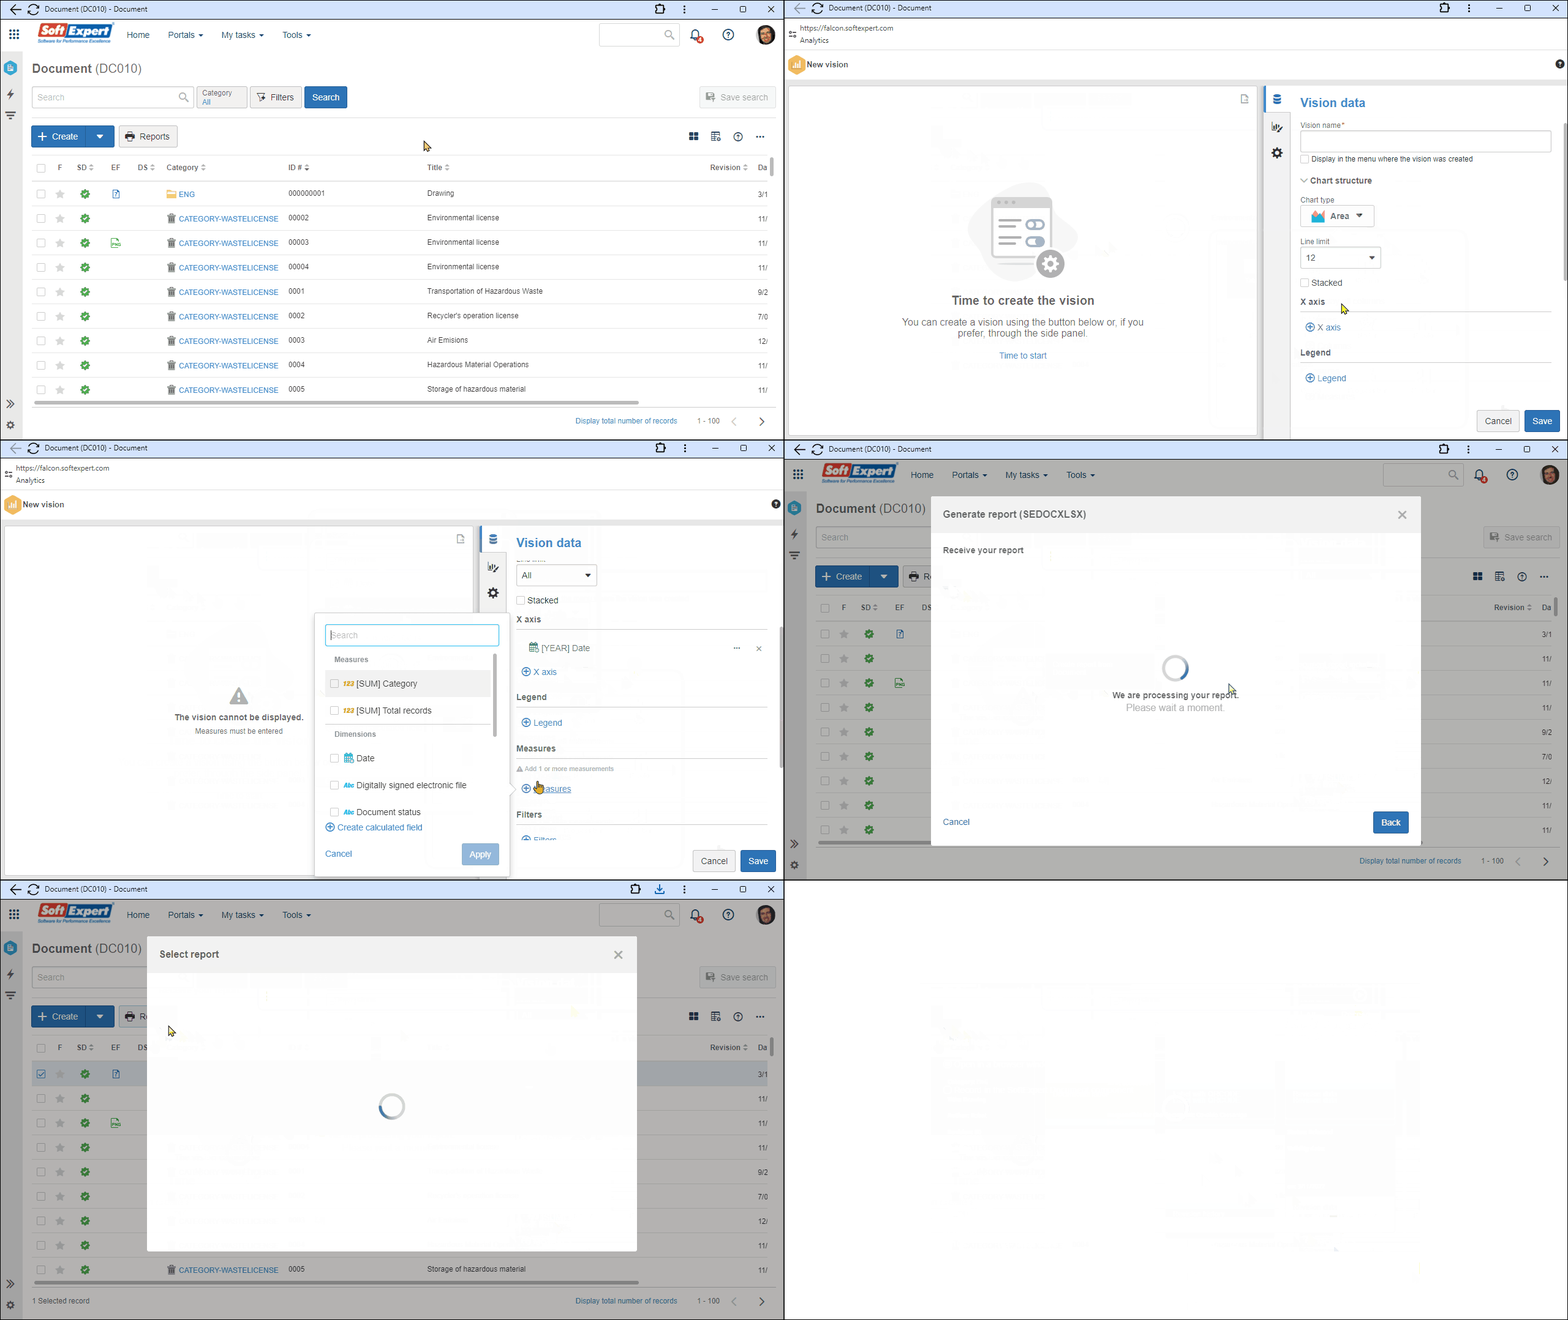
In these unified menus, the report, analysis, and XLSX data export features have also been integrated. Now, upon clicking on the "Reports" button, the user has access to a broad vision of all reports available in the menu.
Moreover, the process to generate each report has been standardized, which allows users to define which pieces of information should be available in reports. This enables users to easily generate customized reports and get valuable insights for even more precise decision-making.

If any customized reports must be added to the unified menus, please contact your account manager. It may be necessary to make adjustments in the report for this purpose.
Improvement in existing chart types
Stacked area
Just as it was possible with column and bar charts, it is now possible to generate a stacked area chart. Thus, the user can represent the composition of different categories throughout time.
Sales analysis by categories throughout time and the use of resources in a project are some examples of charts that can be generated through the stacked area.
Radar with more than one series
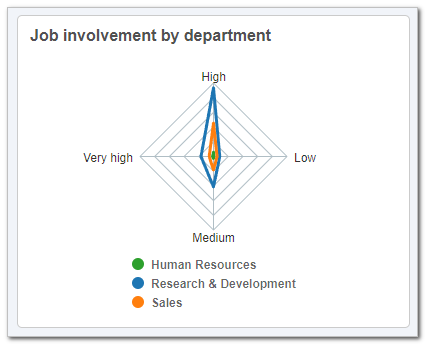
Just as it was possible with other chart types, it is now possible to generate a radar chart with several series. Thus, it is possible to compare several entities or objects in several categories or different metrics.
Performance comparison and ability evaluation are some examples of charts that can be created using radars with the option of several series.

View the latest improvements made to this component: